pandas的DataFram结构与Excel表
已经运读取、写入函数形成了一个DataFram结构,那么我想提取DataFram结构中的具体数值并横向写入Excel中,需要怎么操作呢?
你可以使用Python中的pandas库来读取DataFram结构并将其写入Excel文件中。具体的操作步骤如下:
导入必要的库
python
import pandas as pd
读取DataFram结构数据
python
假设你的DataFram结构名为df
df = pd.read_csv("data.csv")
提取需要的数值列
python
假设你需要提取的列名为col1、col2和col3
new_df = df[["col1", "col2", "col3"]]
将提取出的数值列横向写入Excel文件
python
假设你需要将数据写入Excel文件中的Sheet1工作表
writer = pd.ExcelWriter("output.xlsx", engine="xlsxwriter")
new_df.to_excel(writer, sheet_name="Sheet1", index=False)
writer.save()
在上述代码中,pd.read_csv()函数用于读取CSV格式的数据文件,如果你的数据不是CSV格式,可以选择其他读取函数(如pd.read_excel())进行读取。提取数值列时,你可以根据自己的需要选择需要的列名。在将数据写入Excel文件时,需要创建一个ExcelWriter对象,并将数据写入到指定的工作表中。
- 这篇博客: Pandas笔记中的 4.1.3 DataFram 对象 部分也许能够解决你的问题, 你可以仔细阅读以下内容或跳转源博客中阅读:
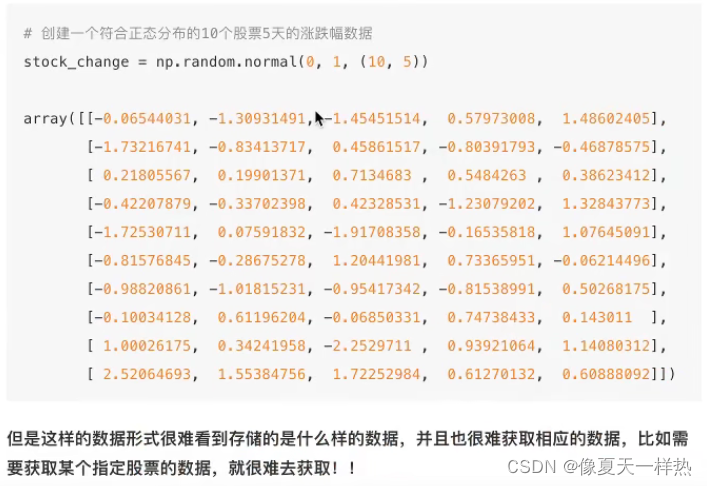
结构:既有行索引,又有列索引的二维数组
import  numpy as np
import pandas as pd


#创建一个符合正态分布的10个股票5天的涨幅数据
stock_change=np.random.normal(loc=0,scale=1,size=(10,5))

#添加行索引
stock=["股票{}".format(i) for i in range(10)]
#添加列索引
#pd.date_range() --用来生成日期
date=pd.date_range(start="20211224",periods=5,freq="B")

data_stocks=pd.DataFrame(stock_change,index=stock,columns=date)
data_stocks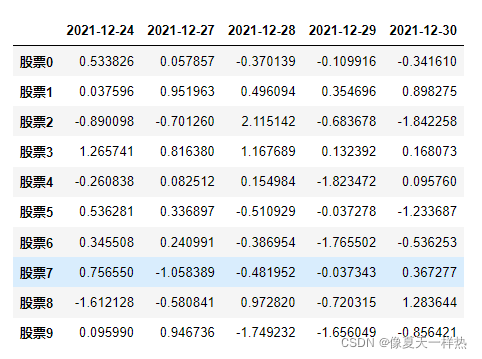
属性:
shape #形状
index #行索引列表
columns #列索引列表
values #直接获取其中array的值
T #转置data_stocks.shape >>> (10, 5)data_stocks.index >>>Index(['股票0', '股票1', '股票2', '股票3', '股票4', '股票5', '股票6', '股票7', '股票8', '股票9'], dtype='object'data_stocks.columns >>>DatetimeIndex(['2021-12-24', '2021-12-27', '2021-12-28', '2021-12-29''2021-12-30'] dtype='datetime64[ns]', freq='B'data_stocks.values >>>array([[ 0.53382629, 0.05785681, -0.37013912, -0.10991607, -0.34161015], [ 0.03759558, 0.95196327, 0.49609403, 0.35469635, 0.89827462], [-0.89009782, -0.70126025, 2.11514223, -0.68367804, -1.84225813], [ 1.26574084, 0.81638033, 1.16768865, 0.13239209, 0.16807341], [-0.2608384 , 0.0825122 , 0.15498428, -1.8234721 , 0.0957601 ], [ 0.53628063, 0.33689679, -0.51092882, -0.03727799, -1.2336869 ], [ 0.34550794, 0.24099083, -0.38695422, -1.76550244, -0.53625289], [ 0.75655038, -1.0583886 , -0.48195212, -0.03734291, 0.36727743], [-1.61212811, -0.58084113, 0.97282033, -0.72031483, 1.28364436], [ 0.09598993, 0.94673641, -1.74923158, -1.65604889, -0.8564206 ]]data_stocks.T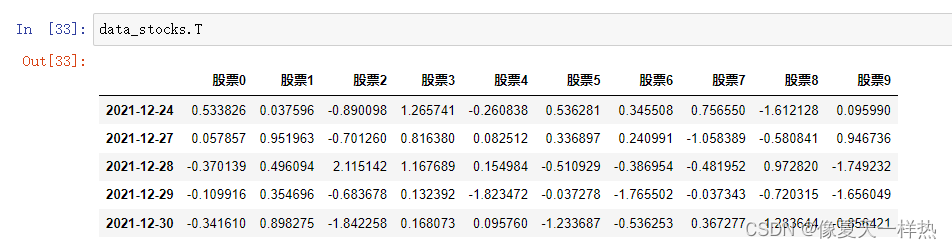
方法:
head() #开头几行,默认返回前5行
tail() #最后几行,默认返回后5行data_stocks.head()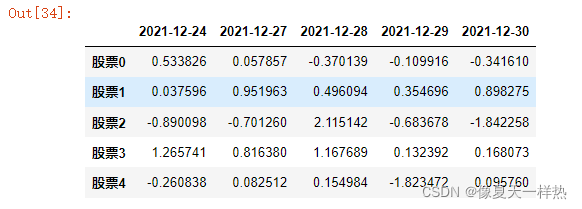
data_stocks.tail(3)
DataFrame索引的设置:1)修改行、列索引值 (只能整体修改)
2)重设索引
3)设置新索引(以某列值设置为新索引)1)修改股票索引:
不能单独修改一个索引。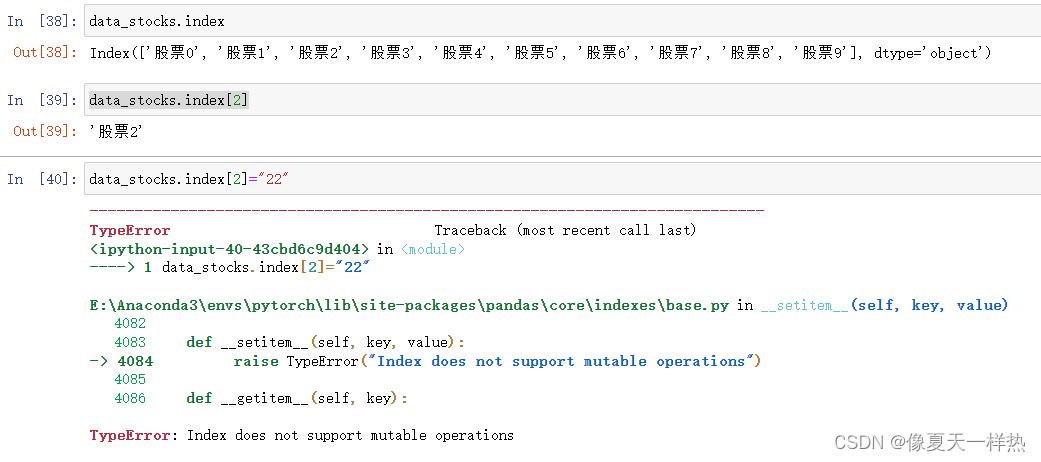
stock_=["股票_{}".format(i) for i in range(10)]
>>>stock_
['股票_0',
 '股票_1',
 '股票_2',
 '股票_3',
 '股票_4',
 '股票_5',
 '股票_6',
 '股票_7',
 '股票_8',
 '股票_9']

data_stocks.index=stock_
data_stocks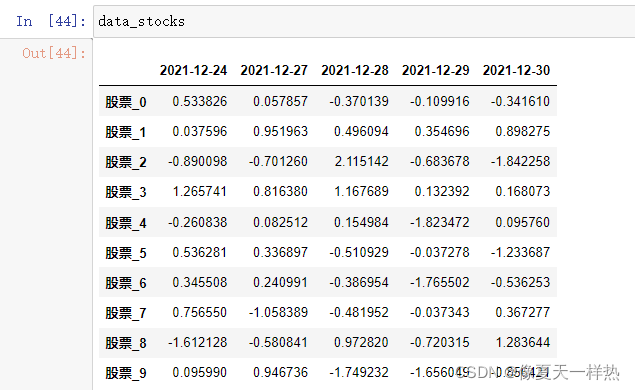
2)重设索引
data_stocks.reset_index()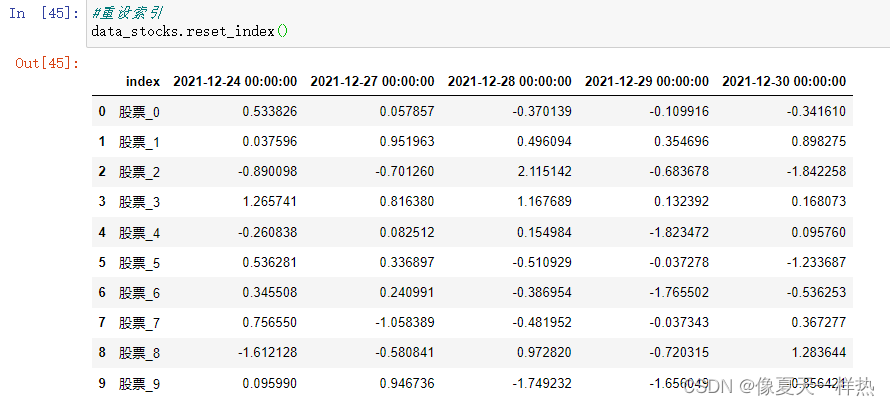
data_stocks.reset_index(drop=True)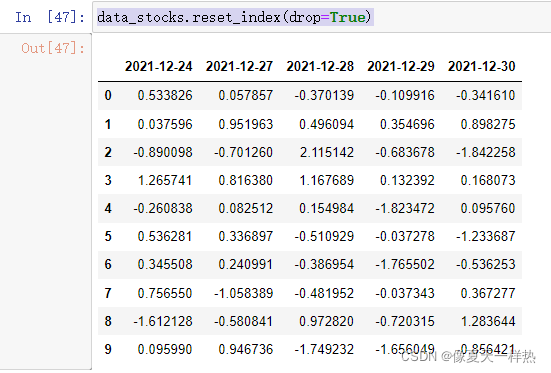
3)设置新索引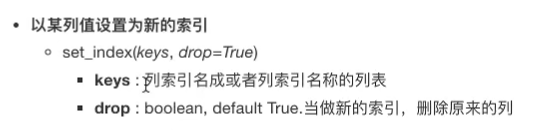
##创建数组
df=pd.DataFrame({'month':[1,4,7,10],
               'year':[2001,2014,2020,2021],
               'sale':[55,30,8,65]})
df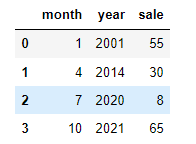
将月份设置为新的索引:df.set_index("month",drop=False)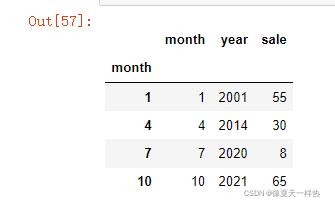
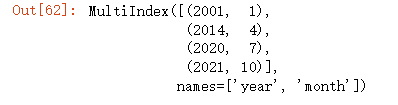
设置多个索引:#设置多个索引 new_df=df.set_index(["year","month"])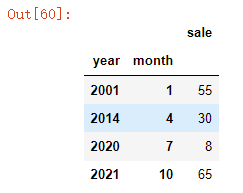
此时index变为多个:new_df.index