画出线性回归图每个点到直线的距离
怎么画出每个点到直线的距离
import numpy as np
import matplotlib.pyplot as plt
from scipy import stats
# 构造训练数据
x = np.arange(0., 10., 0.2)
m = len(x)
x0 = np.full(m, 1.0)
input_data = np.vstack([x0, x]).T
target_data = 2 * x + 5 + np.random.randn(m)
# 终止条件
loop_max = 10000 # 最大迭代次数
epsilon = 1e-3 # 收敛条件最小值
# 初始化权值
np.random.seed(0)
theta = np.random.randn(2)
alpha = 0.001 # 步长
diff = 0.
error = np.zeros(2)
count = 0 # 循环次数
finish = 0 # 终止标志
# 迭代
while count < loop_max:
count += 1
# 在标准梯度下降中,权值更新的每一步对多个样例求和,需要更多的计算
sum_m = np.zeros(2)
for i in range(m):
dif = (np.dot(theta, input_data[i]) - target_data[i]) * input_data[i]
# 当alpha取值过大时,sum_m会在迭代过程中会溢出
sum_m = sum_m + dif
# 注意步长alpha的取值,过大会导致振荡
theta = theta - alpha * sum_m
# 判断是否已收敛
if np.linalg.norm(theta - error) < epsilon:
finish = 1
break
else:
error = theta
print('迭代次数 = %d' % count, '\t w:', theta)
print('迭代次数 = %d' % count, '\t w:', theta)
# 用scipy线性回归进行检查
slope, intercept, r_value, p_value, slope_std_error = stats.linregress(x,
target_data)
print('截距 = %s 斜率 = %s' % (intercept, slope))
# 用plot进行展示
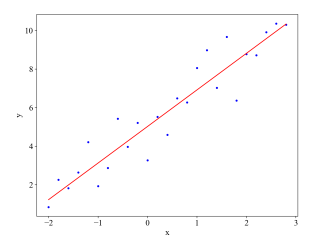
plt.plot(x, target_data, 'b*')
plt.plot(x, theta[1] * x + theta[0], 'r')
plt.xlabel("x")
plt.ylabel("y")
plt.show()
这是代码块
import matplotlib.pyplot as plt
import numpy as np
# 生成示例数据
np.random.seed(0)
x = np.random.rand(20)
y = 2 * x + 1 + np.random.randn(20) * 0.1
# 计算回归线
coef = np.polyfit(x, y, 1)
line_x = np.linspace(0, 1, 2)
line_y = np.polyval(coef, line_x)
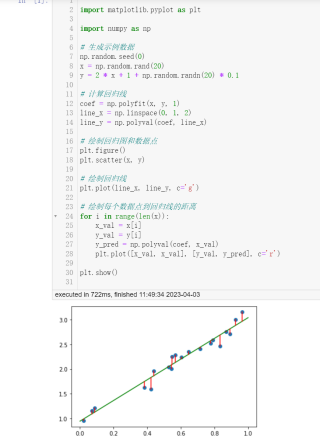
# 绘制回归图和数据点
plt.figure()
plt.scatter(x, y)
# 绘制回归线
plt.plot(line_x, line_y, c='g')
# 绘制每个数据点到回归线的距离
for i in range(len(x)):
x_val = x[i]
y_val = y[i]
y_pred = np.polyval(coef, x_val)
plt.plot([x_val, x_val], [y_val, y_pred], c='r')
plt.show()
好问题!!抱歉我也不太懂,你问问chatGPT吧:https://new.quke123.com/
或者问下其他Python群友:https://app.yinxiang.com/fx/13ce6bbd-f36f-4e92-be53-92dd381ed729
- 你可以参考下这个问题的回答, 看看是否对你有帮助, 链接: https://ask.csdn.net/questions/7585138
- 这篇博客你也可以参考下:【时间序列预测实战】【特征工程与建模】
- 除此之外, 这篇博客: 训练集误差和验证集误差中的 出现的情况 部分也许能够解决你的问题, 你可以仔细阅读以下内容或者直接跳转源博客中阅读:
1.train_loss 不断下降,val_loss(test_lost) 不断下降
说明网络训练正常,最好情况
2.train_loss 不断下降,val_loss(test_lost) 趋于不变
说明网络过拟合,可以添加dropout和最大池化max pooling
3.train_loss 趋于不变,val_loss(test_lost) 不断下降
说明数据集有问题,建议重新选择
4.train_loss 趋于不变,val_loss(test_lost) 趋于不变
说明学习遇到瓶颈,需要减小学习率或批量batch数目
5.train_loss 不断上升,val_loss(test_lost) 不断上升
说明网络结构设计不当,训练超参数设置不当,数据集经过清洗等问题,最差情况
- 您还可以看一下 王恩龙老师的软件测试基础课程中的 软件测试准入准出条件小节, 巩固相关知识点
如果你已经解决了该问题, 非常希望你能够分享一下解决方案, 写成博客, 将相关链接放在评论区, 以帮助更多的人 ^-^