matplotlib显示边框
代码:
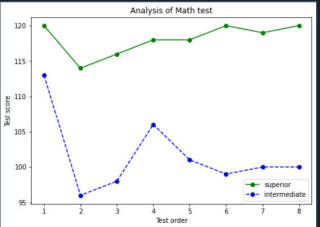
import matplotlib.pyplot as plt
x = [1,2,3,4,5,6,7,8]
y1 = [120,114,116,118,118,120,119,120]
y2 = [113,96,98,106,101,99,100,100]
fig = plt.figure(frameon=True)
ax = fig.add_axes([0,0,1,1])
l1 = ax.plot(x,y1,"go-")
l2 = ax.plot(x,y2,"bo--")
ax.legend(labels=("superior","intermediate"))
ax.set_xlabel("Test order")
ax.set_ylabel("Test score")
ax.set_title("Analysis of Math test")
plt.savefig("got.png")
结果是这样的:
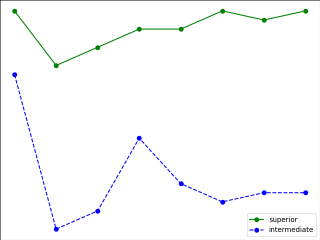
为什么没有显示边框?怎么处理?
能显示啊,是你保存图片的问题
plt.savefig("got.png",bbox_inches = 'tight')
该回答引用ChatGPT
这可能是因为在创建 fig 对象时设置的 frameon 参数被设置为 True,这将禁止显示图形边框。您可以更改这个参数为 False,如下所示:
fig = plt.figure(frameon=False)
- 帮你找了个相似的问题, 你可以看下: https://ask.csdn.net/questions/7515894
- 你也可以参考下这篇文章:Matplotlib解决中文显示问题