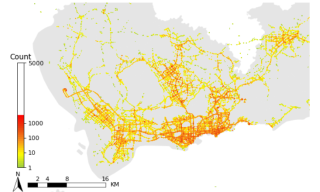
用plt.contourf 绘制等高图图例出现空白,是什么原因
用plt.contourf 绘制等高图图例出现空白,是什么原因,以下是代码:
导入绘图包
import matplotlib as mpl
import matplotlib.pyplot as plt
import transbigdata as tbd
fig = plt.figure(1,(8,8),dpi=80)
ax = plt.subplot(111)
plt.sca(ax)
fig.tight_layout(rect = (0.05,0.1,1,0.9)) #调整整体空白
绘制行政区划的边界
bounds = [113.7,22.42,114.3,22.8]
sz.plot(ax = ax,edgecolor = (0,0,0,0),facecolor = (0,0,0,0.1),linewidths = 0.5)
定义colorbar
cmap = mpl.colors.LinearSegmentedColormap.from_list('cmap',['#9DCC42','#FFFE03','#F7941D','#E9420E','#FF0000'], 256)
绘制等高线图
plt.contourf(x,y,z,levels=levels,cmap=cmap,origin = 'lower')
添加比例尺和指北针
tbd.plotscale(ax,bounds=bounds,textsize=10,compasssize=1,accuracy=2000,rect = [0.06,0.03])
plt.axis('off')
plt.xlim(bounds[0],bounds[2])
plt.ylim(bounds[1],bounds[3])
绘制colorbar
cax = plt.axes([0.13,0.31,0.02,0.3])
cbar = plt.colorbar(cax=cax)
调整colorbar的显示标记位置
val = [1,10,100,1000,5000]
pos = np.log(np.array(val))
在什么位置显示标记
cbar.set_ticks(pos)
标记显示什么内容
cbar.set_ticklabels(val)
plt.title('Count')
plt.show()
- 你看下这篇博客吧, 应该有用👉 :plt.contourf()