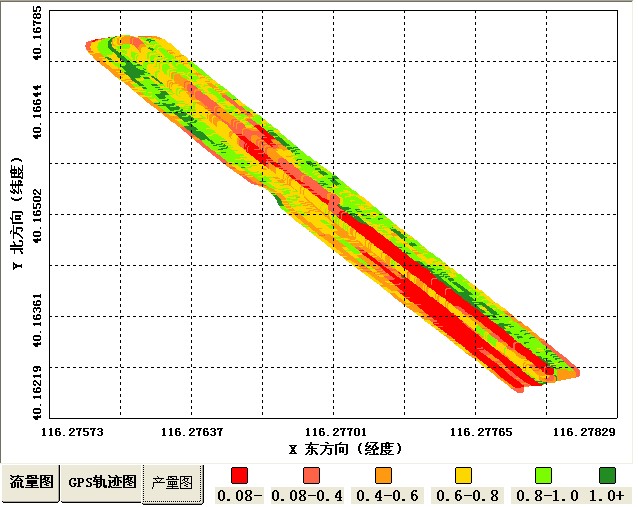
求大佬们快出现。怎么用C#实现文本读取数据(经度,纬度,粮食产量)并画出来这种图啊?
GDI+的接口足够用了,你这张图里面的元素无非就是“实线”,“虚线”,“文字”还有实际值(可以画成单位像素的矩形),这些GDI的接口足够实现。第一步画表格,就是几条实线和虚线,无非就是计算这些线的起点和终点的坐标直接调用GDI画线的接口。第二步无非是根据横纵坐标值计算某个点的值应该是什么颜色的,然后把它对象的颜色画成一个单位像素的矩形就行了。 总之这个没有什么难度,有的只是复杂度,问题的核心无非是计算坐标,计算值调用GDI的画线,画矩形等接口。
我已经帮你实现了个大概:
核心类代码:
using System;
using System.Collections.Generic;
using System.Drawing;
using System.Drawing.Drawing2D;

namespace SummaryGraph
{
    public class GrainYieldMap
    {
        public class Distribution
        {
            /// <summary>
            /// 纬度
            /// </summary>
            public float Latitude { get; set; }
            /// <summary>
            /// 经度
            /// </summary>
            public float Longitude { get; set; }
            /// <summary>
            /// 值
            /// </summary>
            public float Value { get; set; }
            /// <summary>
            /// 根据值计算颜色
            /// </summary>
            public Color Color
            {
                get
                {
                    if (Value < 0.08f)
                    {
                        return Color.Red;
                    }
                    else if (Value >= 0.08f && Value < 0.4f)
                    {
                        return Color.OrangeRed;
                    }
                    else if (Value >= 0.4f && Value < 0.6f)
                    {
                        return Color.Orange;
                    }
                    else if (Value >= 0.6f && Value < 0.8f)
                    {
                        return Color.Yellow;
                    }
                    else if (Value >= 0.8f && Value < 1f)
                    {
                        return Color.LightGreen;
                    }
                    else
                    {
                        return Color.Green;
                    }
                }
            }
        }
        /// <summary>
        /// 在这里考虑可能上万条数据插入比较慢所以加上同步锁,防止分布点的时候修改分布点数据的集合
        /// </summary>
        private readonly object SyncRoot = new object();
        /// <summary>
        /// x方向单元格个数
        /// </summary>
        public int XCount { get; set; }
        /// <summary>
        /// y方向单元格个数
        /// </summary>
        public int YCount { get; set; }
        /// <summary>
        /// 每个x方向单元格经度跨度
        /// </summary>
        public float UnitX { get; set; }
        /// <summary>
        /// 每个y单元格纬度跨度
        /// </summary>
        public float UnitY { get; set; }
        /// <summary>
        /// 每个x方向单元格所占实际像素(像素)
        /// </summary>
        public float UnitXLength { get; set; }
        /// <summary>
        /// 每个y方向单元格所占实际像素(像素)
        /// </summary>
        public float UnitYLength { get; set; }
        /// <summary>
        /// 整张图上边距(像素)
        /// </summary>
        public float MarginTop { get; set; }
        /// <summary>
        /// 整张图下边距(像素)
        /// </summary>
        public float MarginLeft { get; set; }
        private float originLatitude;
        /// <summary>
        /// 坐标原点维度值
        /// </summary>
        public float OriginLatitude
        {
            get
            {
                return originLatitude;
            }
            set
            {
                if (value < -90f || value > 90) throw new ArgumentOutOfRangeException("纬度取值范围为-90°到90°");
                originLatitude = value;
            }
        }
        private float originLongitude;
        /// <summary>
        /// 坐标原点经度值
        /// </summary>
        public float OriginLongitude
        {
            get
            {
                return originLongitude;
            }
            set
            {
                if (value < -180f || value > 180) throw new ArgumentOutOfRangeException("经度取值范围为-180°到180°");
                originLongitude = value;
            }
        }
        /// <summary>
        /// 整张图的宽度(像素)
        /// </summary>
        public float MapWidth
        {
            get
            {
                return XCount * UnitXLength;
            }
        }
        /// <summary>
        /// 整张图的高度(像素)
        /// </summary>
        public float MapHeight
        {
            get
            {
                return YCount * UnitYLength;
            }
        }
        /// <summary>
        /// 坐标轴原点x(像素)
        /// </summary>
        public float AxisX
        {
            get
            {
                return MarginLeft;
            }
        }
        /// <summary>
        /// 坐标轴原点y(像素)
        /// </summary>
        public float AxisY
        {
            get
            {
                return MarginTop + MapHeight;
            }
        }

        /// <summary>
        /// 分布图的数据集合
        /// </summary>
        public List<Distribution> DistributionData { get; private set; }

        public GrainYieldMap()
        {
            DistributionData = new List<Distribution>();
        }
        /// <summary>
        /// 增加一条分布数据
        /// </summary>
        /// <param name="data"></param>
        public void AddDistributionData(Distribution data)
        {
            lock (SyncRoot)
            {
                DistributionData.Add(data);
            }
        }
        /// <summary>
        /// 画分布图
        /// </summary>
        /// <param name="e"></param>
        public void DrawMap(Graphics e)
        {
            DrawBackground(e);
            DrawDistribution(e);
            DrawAxis(e);
        }
        /// <summary>
        /// 画坐标轴
        /// </summary>
        /// <param name="e"></param>
        private void DrawAxis(Graphics e)
        {
            //画坐标轴边框(4条实线)
            PointF[] VertexArray = new PointF[]
            {
                new PointF(MarginLeft, MarginTop),
                new PointF(MarginLeft+ MapWidth, MarginTop),
                new PointF(MarginLeft+ MapWidth, MarginTop + MapHeight),
                new PointF(MarginLeft, MarginTop + MapHeight),
                new PointF(MarginLeft, MarginTop)
            };
            e.DrawLines(new Pen(Color.Black), VertexArray);
            Pen pen = new Pen(Color.Black, 1);
            pen.DashStyle = DashStyle.Dash;
            Font font = new Font("宋体", 10f, FontStyle.Bold);
            //画所有竖向虚线
            for (int x = 1; x < XCount; x++)
            {
                e.DrawLine(pen, new PointF(MarginLeft + x * UnitXLength, MarginTop), new PointF(MarginLeft + x * UnitXLength, MarginTop + MapHeight));
                //每隔一个单元显示x坐标值
                if (x % 2 == 0)
                {
                    string content = (OriginLongitude + UnitX * x).ToString();
                    SizeF strSize = e.MeasureString(content, font);
                    e.DrawString(content, font, new SolidBrush(Color.Black), MarginLeft + x * UnitXLength - strSize.Width / 2f, MarginTop + MapHeight + 10f);
                }

            }
            //画所有横向虚线
            for (int y = 1; y < YCount; y++)
            {
                e.DrawLine(pen, new PointF(MarginLeft, MarginTop + y * UnitYLength), new PointF(MarginLeft + MapWidth, MarginTop + y * UnitYLength));
                //每隔一个单元显示y坐标值
                if (y % 2 == 0)
                {
                    string content = (OriginLatitude + UnitY * y).ToString();
                    SizeF strSize = e.MeasureString(content, font);
                    e.DrawString(content, font, new SolidBrush(Color.Black), MarginLeft - strSize.Width - 10f, MarginTop + MapHeight - y * UnitYLength - strSize.Height / 2);
                }
            }
        }
        /// <summary>
        /// 画分布点
        /// </summary>
        /// <param name="e"></param>
        private void DrawDistribution(Graphics e)
        {
            lock (SyncRoot)
            {
                for (int i = 0; i < DistributionData.Count; i++)
                {
                    //计算当前经纬点相对坐标轴原点的偏移坐标
                    //
                    //在这里计算真实坐标的时候注意f(x,y)=>f(x + MarginLeft,-y + MarginTop + MapHeight)的坐标系变换
                    //
                    float offsetLatitude = MarginTop + MapHeight - (DistributionData[i].Latitude - OriginLatitude) * (UnitYLength / UnitY);
                    float offsetLongitude = (DistributionData[i].Longitude - OriginLongitude) * (UnitXLength / UnitX) + MarginLeft;
                    //画分布点
                    e.FillRectangle(new SolidBrush(DistributionData[i].Color), offsetLongitude, offsetLatitude, 2f, 2f);
                }
            }
        }
        /// <summary>
        /// 画图的背景色
        /// </summary>
        /// <param name="e"></param>
        private void DrawBackground(Graphics e)
        {
            e.FillRectangle(new SolidBrush(Color.White), MarginLeft, MarginTop, MapWidth, MapHeight);
        }
    }
}
调用代码:
using System;
using System.Windows.Forms;

namespace SummaryGraph
{
    public partial class Form1 : Form
    {
        GrainYieldMap Map;

        public Form1()
        {
            InitializeComponent();

            //测试代码
            Map = new GrainYieldMap();
            Map.UnitX = 0.001f;
            Map.UnitY = 0.00142f;
            Map.OriginLatitude = 40.16219f;
            Map.OriginLongitude = 116.27573f;
            Map.MarginLeft = 100f;
            Map.MarginTop = 100f;
            Map.UnitXLength = 80f;
            Map.UnitYLength = 50f;
            Map.XCount = 10;
            Map.YCount = 10;

            //在这里随机生成3万个分布点的数据,由于Random是白噪声随机函数完全随机,所以生成的效果可能比较散
            //按你的需求应该改成从文件中读取经纬度信息以及值是多少
            Random random = new Random();
            for (int i = 0; i < 30000; i++)
            {
                GrainYieldMap.Distribution point = new GrainYieldMap.Distribution();
                point.Value = (float)random.NextDouble() * 1.2f;
                point.Latitude = Map.OriginLatitude + (float)random.NextDouble() / 100f;
                point.Longitude = Map.OriginLongitude + (float)random.NextDouble() / 100f;
                Map.AddDistributionData(point);
            }
        }

        private void Form1_Paint(object sender, PaintEventArgs e)
        {
            Map.DrawMap(e.Graphics);
        }
    }
}
效果图: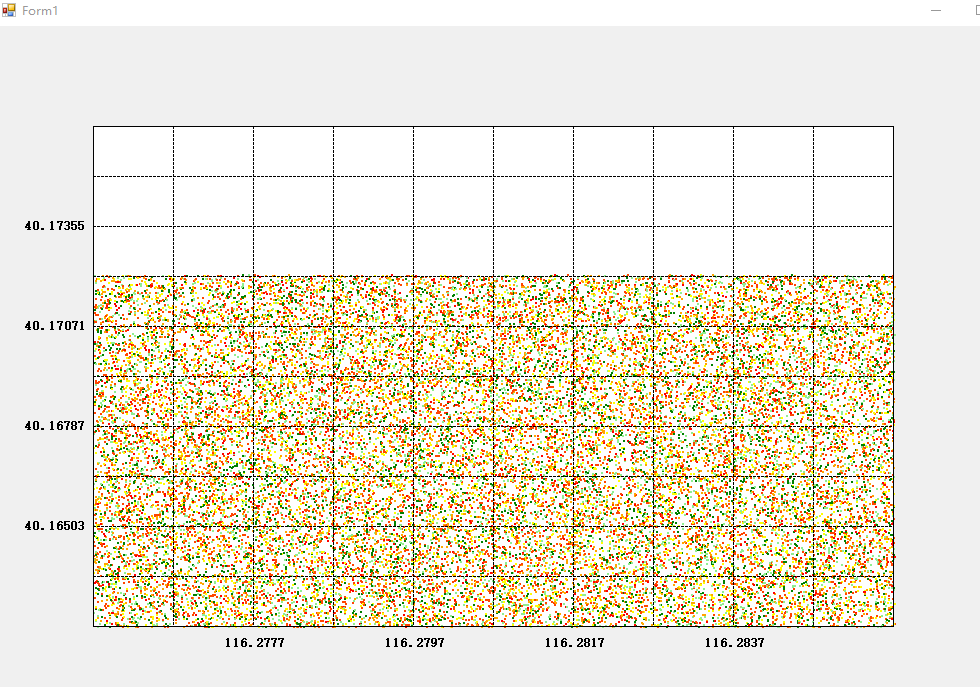
其他说明:
图之所以和你的不一样是因为我测试的数据都是生成的白噪声随机数,所以比较散,用你真实的数据应该就比较接近你截图的效果了
文本是什么文本,文本的数据是什么格式怎么存的,这张图是什么意思,跟文本的数据有什么关系,如果不方便透露可以不说。
按你题目的要求,我可以声明一个流处理变量打开随便一个txt,然后输出下载好的这张图片。
如果你需要这种效果也行。
找一个C#的画图库,画一个散点图不就 OK 了,坐标轴就是经纬度
不知道为什么画出来是一个斜线,感觉就是热力图,参考:
https://blog.csdn.net/xy_int/article/details/81533935
https://bbs.csdn.net/topics/392204536
https://www.jianshu.com/p/3ced545224f1