关于highcharts散点图的问题
想画一个如图样子的散点图,div的宽为144.8,高为166,请问应该在哪些地方做哪些修改,能提供修改后的代码是最好了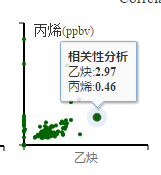
$(function () {
$('#div的id').highcharts({

    chart: {

        type: 'scatter',

        zoomType: 'xy'

    },

    title: {

        text: '主标题(不要可去掉)'

    },

    subtitle: {

        text: '子标题(不要可去掉)'

    },

    xAxis: {

        title: {

            enabled: true,

            text: 'x轴名称'

        },

        startOnTick: true,

        endOnTick: true,

        showLastLabel: true

    },

    yAxis: {

        title: {

            text: 'Y轴名称'

        }

    },

    legend: {

        layout: 'vertical',

        align: 'left',

        verticalAlign: 'top',

        x: 100,

        y: 70,

        floating: true,

        backgroundColor: (Highcharts.theme && Highcharts.theme.legendBackgroundColor) || '#FFFFFF',

        borderWidth: 1

    },

    plotOptions: {

        scatter: {

            marker: {

                radius: 5,

                states: {

                    hover: {

                        enabled: true,

                        lineColor: 'rgb(100,100,100)'

                    }

                }
 $(function () {
    $('#div的id').highcharts({
        chart: {
            type: 'scatter',
            zoomType: 'xy'
        },
        title: {
            text: '主标题(不要可去掉)'
        },
        subtitle: {
            text: '子标题(不要可去掉)'
        },
        xAxis: {
            title: {
                enabled: true,
                text: 'Y轴名称'
            },
            startOnTick: true,
            endOnTick: true,
            showLastLabel: true
        },
        yAxis: {
            title: {
                text: 'X轴名称'
            }
        },
        legend: {
            layout: 'vertical',
            align: 'left',
            verticalAlign: 'top',
            x: 100,
            y: 70,
            floating: true,
            backgroundColor: (Highcharts.theme && Highcharts.theme.legendBackgroundColor) || '#FFFFFF',
            borderWidth: 1
        },
        plotOptions: {
            scatter: {
                marker: {
                    radius: 5,
                    states: {
                        hover: {
                            enabled: true,
                            lineColor: 'rgb(100,100,100)'
                        }
                    }
                },
                states: {
                    hover: {
                        marker: {
                            enabled: false
                        }
                    }
                },
                tooltip: {
                    headerFormat: '<b>{series.name}</b><br>',
                    pointFormat: '{point.x} cm, {point.y} kg'
                }
            }
        },
        series: [{
            name: '数据源名称1',
            color: 'rgba(223, 83, 83, .5)',
            data: []//数据
        }, {
            name: '数据源名称2',
            color: 'rgba(119, 152, 191, .5)',
            data: [[x值, y值],...[x值,y值]]//数据
        }]
    });
});
自己研究出来了
//原型
areaChart={
chart: {
type: 'scatter',
zoomType: 'xy'
},
title :{
text:null
},
legend :{
enabled:false
},
exporting:{
enabled:false
},
credits: {
enabled: false
},
xAxis: {
lineColor:'#000000',
tickColor:'#000000',
lineWidth:2,
tickWidth:2,
tickLength:5,
startOnTick:true,
endOnTick:true,
showLastLabel:true,
min:0,
title:{
text:''
},
labels: {
enabled: false
}
},
yAxis: {
lineColor:'#000000',
tickColor:'#000000',
lineWidth: 2,
tickWidth:2,
tickLength:5,
gridLineWidth:0,
startOnTick:true,
endOnTick:true,
min:null,
floor:0,
//max:0.5,
title:{
text:''
},
labels: {
enabled: false
}
},
plotOptions: {
scatter: {
marker: {
radius: 2.5,
states: {
hover: {
enabled: true,
lineColor: 'rgb(100,100,100)'
}
}
},
states: {
hover: {
marker: {
enabled: false
}
}
},
tooltip: {
headerFormat:'',
pointFormat: '时间:{point.time}
{point.namex}:{point.x}
{point.namey}:{point.y}'
}
}
},
series: [{
color: 'rgb(0,87,55)',
data:[]
}]
};