matlab图片,寻找此colormap的设置参数
有没有下图所示的colormap的参数,这好像不是软件内置的colormap,图片是我从Field2的输出图中截下来的。
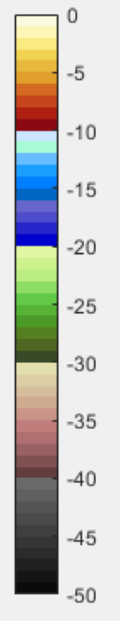
设置不用完全一样,比较接近也可以。
#fcfade
#fdf6b6
#faea82
#f2d252
#e8b83d
#e09e2b
#d46921
#c7451a
#b02012
#8a0812
#cce6ff
#a6fad6
#66bdff
#1a9eff
#0080ff
#0066c4
#6666cc
#4d4dcc
#2626cc
#0000cc
#e0f7a1
#cff291
#bbed82
#8fde64
#61c947
#57b336
#4b9926
#548022
#4e661f
#384a27
#e4dfae
#ddcfa5
#d6be9c
#cfab92
#c89588
#c17c7c
#ae7070
#996262
#805151
#623d3d
#6a6a6a
#606060
#555555
#4a4a4a
#404040
#353535
#2b2b2b
#202020
#151515
#0b0b0b
(1)问题分析
matlab中colorbar的颜色设置可以通过colormap函数实现,colormap的参数是多行3列的rgb颜色数组(在[0,1]之间取值),colormap参数的第一行表示数据最小值的颜色,colormap参数的最后一行表示数据最大值的颜色。为得到所需的colormap参数,可以先将目标的colorbar进行截图,只保留带有颜色的部分,然后通过imread函数读取截图得到所需的colormap参数,再通过colormap函数设置colorbar。本回答所采用的的colorbar截图"问题描述2_裁剪.png"如下:

(2)问题的matlab解决代码
%Get colormap_mat
clear;clc;
image_data=imread('问题描述2_裁剪.png');
colormap_mat=double(squeeze(image_data(:,round(size(image_data,2)/2),:)))/255;
colormap_mat=flipud(colormap_mat);

%Test colorbar
x=0:0.01:1;
y=(0:0.01:1).';
data=-50*(y*x);
imagesc(x,y,data);
colorbar;
colormap(colormap_mat);
(3)代码运行结果

- 关于该问题,我找了一篇非常好的博客,你可以看看是否有帮助,链接:matlab图像处理作业分析 colormap的创建
- 除此之外, 这篇博客: matlab中使用colormap没有效果中的 方法2 部分也许能够解决你的问题, 你可以仔细阅读以下内容或跳转源博客中阅读:
R2016b和R2017a都可
clc, clear, close all
figure(1);
grayimg =imread('grayimg.jpg');
imshow(grayimg);
figure(2);
B=fftshift(fft2(grayimg));
AxesH = axes;
imshow(log(abs(B)),[], 'Parent', AxesH);
colormap(AxesH, jet(64));
colorbar;
最后结果:

自定义的map:
map = [252,250,222
253,246,182
250,234,130
242,210,82
232,184,61
224,158,43
212,105,33
199,69,26
176,32,18
138,8,18
204,230,255
166,250,214
102,189,255
26,158,255
0,128,255
0,102,196
102,102,204
77,77,204
38,38,204
0,0,204
224,247,161
207,242,145
187,237,130
143,222,100
97,201,71
87,179,54
75,153,38
84,128,34
78,102,31
56,74,39
228,223,174
221,207,165
214,190,156
207,171,146
200,149,136
193,124,124
174,112,112
153,98,98
128,81,81
98,61,61
106,106,106
96,96,96
85,85,85
74,74,74
64,64,64
53,53,53
43,43,43
32,32,32
21,21,21
11,11,11
]./255;
colormap(map)
colorbar

或者可以在figure窗口的编辑->颜色图(colorbar)中自定义颜色元素:

内置比较像的colormap也就colorcube了:
