vue,Echarts显示数据不完全
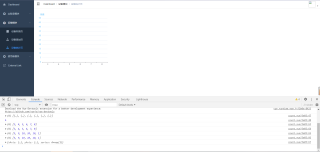
vue里用Echarts显示图表,x轴可以显示,但是图表数据没有显示
<template>
<div>
<div id="main" style="width: 500px;height: 400px">div>
div>
template>
<script>
import * as echarts from 'echarts';
export default {
name: 'count',
data(){
return{
}
},
mounted() {
var chartDom = document.getElementById('main');
var myChart = echarts.init(chartDom);
var option = {
xAxis: {
type: 'category',
data: []
},
yAxis: {
name: '数值',
type: 'value',min:0, // 设置y轴刻度的最小值
max:50, // 设置y轴刻度的最大值
splitNumber:9, // 设置y轴刻度间隔个数
axisLine: {
lineStyle: {
// 设置y轴颜色
color: '#87CEFA'
}
},
},
series: [
{
data: [],
type: 'line'
}
]
};
fetch("http://localhost:8080/equipment/getcount").then(response => response.json()).then(res =>{
res = res.data;
console.log(res);
console.log(res.length);
let oldList = option.xAxis.data || [];
let oldList2 = option.series.data || [];
for(let i=0;ilength ;i++){
oldList.push(res[i].labid);
}
option.xAxis.data=oldList;
for(let j=0;jlength;j++){
oldList2.push(res[j].num);
}
option.series.data=oldList2;
console.log(oldList);
console.log(option.xAxis.data)
console.log(oldList2);
console.log(option.series.data)
console.log(option);
myChart.setOption(option);
})
}
}
script>
<style scoped>
style>
显示结果是这样的
参考GPT和自己的思路:
根据你提供的代码和截图,可能是因为你在使用Echarts时没有正确传入数据导致图表数据没有显示。建议检查以下两个点:
在option中使用的数据数组名称是
series,但是在代码中却使用了option.series.data,这会导致数据无法正确传入。建议将代码中的option.series.data改为option.series[0].data。在将接口返回的数据加入到option中时,先要清空原数组,否则会产生累加效果。建议在清空原数组后再进行数据推入。
修改后的代码如下:
<template>
  <div>
    <div id="main" style="width: 500px;height: 400px"></div>
  </div>
</template>

<script>
import * as echarts from 'echarts';

export default {
  name: 'count',
  data(){
    return{}
  },
  mounted() {
    var chartDom = document.getElementById('main');
    var myChart = echarts.init(chartDom);
    var option = {
      xAxis: {
        type: 'category',
        data: []
      },
      yAxis: {
        name: '数值',
        type: 'value',
        min:0, // 设置y轴刻度的最小值
        max:50, // 设置y轴刻度的最大值
        splitNumber:9, // 设置y轴刻度间隔个数
        axisLine: {
          lineStyle: {
            // 设置y轴颜色
            color: '#87CEFA'
          }
        },
      },
      series: [
        {
          data: [],
          type: 'line'
        }
      ]
    };

    fetch("http://localhost:8080/equipment/getcount")
    .then(response => response.json())
    .then(res =>{
      res = res.data;
      console.log(res);
      console.log(res.length);

      let oldList = option.xAxis.data || [];
      let oldList2 = option.series[0].data || []; // 修改

      oldList = []; // 清空数组
      oldList2 = []; // 清空数组

      for(let i=0;i<res.length;i++){
        oldList.push(res[i].labid);
      }
      option.xAxis.data=oldList;

      for(let j=0;j<res.length;j++){
        oldList2.push(res[j].num);
      }
      option.series[0].data=oldList2; // 修改
      console.log(oldList);
      console.log(option.xAxis.data)
      console.log(oldList2);
      console.log(option.series[0].data) // 修改
      console.log(option);

      myChart.setOption(option);
    })
  }
}
</script>

<style scoped>

</style>
- 你可以看下这个问题的回答https://ask.csdn.net/questions/7541741
- 我还给你找了一篇非常好的博客,你可以看看是否有帮助,链接:Vue打包后Echarts图表不显示问题解决
看看是不是图表的大小不正确,没有显示出来
多谢老哥们解答,顺便贴一个解决后的前端代码
<template>
  <div class="count">
    <div id="main" style="width: 600px;height: 500px"></div>
    <div id="main2" style="width: 600px;height: 500px"></div>
  </div>
</template>

<script>
import * as echarts from 'echarts';

export default {
  name: 'count',
  data(){
    return{
      oldList:[],
      oldList2:[],
      oldList3:{}
    }
  },
  methods:{
    echarts1(){
      var chartDom = document.getElementById('main');
      var myChart = echarts.init(chartDom);
      var option = {
        title: {
          text: '各个实验室的设备统计:'
        },
        tooltip: {
          trigger: 'axis'
        },
        xAxis: {
          type: 'category',
          data: this.oldList,
          name: '实验室种类'
        },
        yAxis: {
          name: '设备个数',
          type: 'value',
          axisLine: {
            lineStyle: {
              // 设置y轴颜色
              color: '#87CEFA'
            }
          },
        },
        series: [
          {
            data: this.oldList2,
            type: 'line',
          }
        ]
      };
      option && myChart.setOption(option);
    },
    echarts2(){
      var chartDom2 = document.getElementById('main2');
      var myChart2 = echarts.init(chartDom2);
      var option ={
        tooltip: {
          trigger: 'item'
        },
        title: {
          text: '厂家统计',
        },
        legend: {
          top: '5%',
          left: 'center'
        },
        series: [
          {
            type: 'pie',
            radius: ['40%', '70%'],
            avoidLabelOverlap: false,
            itemStyle: {
              borderRadius: 10,
              borderColor: '#fff',
              borderWidth: 2
            },
            label: {
              show: false,
              position: 'center'
            },
            emphasis: {
              label: {
                show: true,
                fontSize: 40,
                fontWeight: 'bold'
              }
            },
            labelLine: {
              show: false
            },
            data: this.oldList3
          }
        ]
      };
      option && myChart2.setOption(option);
    }

},
  mounted() {
    fetch("http://localhost:8080/equipment/getcount").then(response => response.json()).then(res =>{
      res = res.data;
      console.log(res);
      console.log(res.length);
      for(let i=0;i<res.length;i++){
        this.oldList.push(res[i].name);
      }

      for(let j=0;j<res.length;j++){
        this.oldList2.push(res[j].num);
      }
      this.echarts1();
    });
    fetch("http://localhost:8080/equipment/getManu").then(response => response.json()).then(res =>{
      res = res.data;
      console.log(res);
      this.oldList3 = res.map(item=>({value:item.num,name:item.manufactor}))
      this.echarts2();
    });
  }
}
</script>

<style scoped>
  .count{
    padding: 20px;
  }
</style>