python求解决,有偿
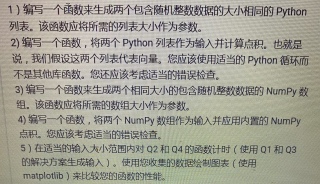
一共是5道,因为缺席了半个月的课,现在听不懂了,求帮忙,谢谢
import numpy as np
import random
import time
import matplotlib.pyplot as plt


# 生成随机整数列表
def create_list(n):
    nums = []
    for i in range(0, n):
        nums.append(random.randint(0, 100))
    return nums


# 求两个列表的点积
def list_dot(K, L):
    if len(K) == len(L) and len(K) != 0:
        return sum([K[n] * L[n] for n in range(len(K))])
    else:
        return 0


# 生成随机整数numpy数组
def create_numpy(n):
    return np.random.randint(0, 100, n)


# 计算numpy点积
def numpy_dot(K, L):
    return np.dot(K, L)


if __name__ == '__main__':
    x = []
    list_y = []
    numpy_y = []
    # 循环十次,用于matplotlib绘图数据
    for i in range(1, 11):
        list_one = create_list(i * 1000)
        list_two = create_list(i * 1000)
        list_dot_start = time.time()
        list_dot_result = list_dot(list_one, list_two)
        list_dot_end = time.time()
        numpy_one = create_numpy(i * 1000)
        numpy_two = create_numpy(i * 1000)
        numpy_dot_start = time.time()
        numpy_dot_result = numpy_dot(numpy_one, numpy_two)
        numpy_dot_end = time.time()
        list_dot_diff = list_dot_end - list_dot_start
        numpy_dot_diff = numpy_dot_end - numpy_dot_start
        x.append(i * 1000)
        list_y.append(list_dot_diff)
        numpy_y.append(numpy_dot_diff)
    # 绘图
    plt.rcParams["font.sans-serif"] = ["SimHei"]  # 设置字体
    plt.rcParams["axes.unicode_minus"] = False  # 该语句解决图像中的“-”负号的乱码问题
    plt.figure(figsize=(12, 8))
    plt.plot(x, list_y, color='red')
    plt.plot(x, numpy_y, color='blue')
    plt.ylabel("函数运行时间")
    plt.xlabel("数据大小")
    plt.grid()
    plt.show()
import time
import random
import numpy as np
import matplotlib.pyplot as plt
def get_list(n):
return random.sample(range(1, n *10 ), k = n), random.sample(range(1, n *10 ), k = n)
list1, list2 = get_list(10)
print(list1, list2)
def lst_dotmul(lst1, lst2):
if lst1 and lst2:
if len(lst1) == len(lst2):
return sum(map(lambda x, y: x *y, lst1, lst2))
res = lst_dotmul([1, 2, ], [4, 6])
print(res)
def get_array(n):
return np.random.randint(1, n *10, n), np.random.randint(1, n *10, n)
arr1, arr2 = get_array(10)
print(arr1, arr2)
def arr_dotmul(arr1, arr2):
if arr1.any() and arr2.any() :
if len(arr1) == len(arr2):
return np.dot(arr1, arr2)
arr = arr_dotmul(np.array([]), arr2)
print(arr)
def get_time(size, flag ='lst'):
x_size = range(size, size + 100)
y_time = []
for i in x_size:
t1 = time.time()
if flag == 'lst':
lst1 , lst2 = get_list(i)
lst_dotmul(lst1, lst2)
else:
arr1, arr2 = get_array(i)
arr_dotmul(arr1, arr2)
t2 = time.time()
y_time.append(int((t2 - t1) *10000))
return x_size, y_time
x, y = get_time(1000)
x1, y1 = get_time(1000, 'arr')
plt.rcParams['font.family'] = 'SimHei'
plt.subplot(1, 2, 1)
plt.title("列表情况")
plt.plot(x, y)
plt.xlabel('数据规模')
plt.ylabel('时间(秒)*10000')
plt.subplot(1, 2, 2)
plt.title("数组情况")
plt.plot(x1, y1)
plt.xlabel('数据规模')
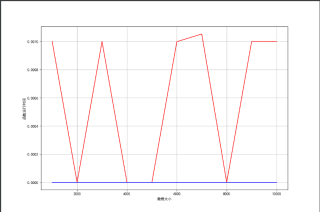
#如果做到一张图上,可以用下面的,结果如图2
plt.rcParams['font.family'] = 'SimHei'
plt.title("性能对比")
plt.plot(x, y, color = 'red', label = '列表[random库]')
plt.plot(x1, y1, color = 'blue', label = '数组[numpy库]')
plt.xlabel('数据规模')
plt.ylabel('时间(秒)*10000')
plt.legend()
plt.show()


import numpy
import random
import time
from matplotlib import pyplot as plt


# 1
def function1(size: int) -> tuple:
    """
    :param size: 列表大小
    :return:
    """
    arr1 = [random.randint(1, 1000) for i in range(size)]
    arr2 = [random.randint(1, 1000) for i in range(size)]
    return arr1, arr2


# 2
def function2(arr1: list, arr2: list) -> int:
    """
    :param arr1:
    :param arr2:
    :return:
    """
    length1 = len(arr1)
    length2 = len(arr2)
    if length1 != length2:
        raise Exception("长度不同")
    res = 0
    for i in range(length1):
        res += arr1[i] * arr2[i]
    return res


# 3
def function3(size: int) -> numpy.array:
    """
    :param size: 数组大小
    :return:
    """
    arr1 = numpy.random.randint(low=1, high=1000, size=size)
    arr2 = numpy.random.randint(low=1, high=1000, size=size)
    return arr1, arr2


# 4
def function4(arr1: numpy.array, arr2: numpy.array) -> int:
    """
    :param arr1:
    :param arr2:
    :return:
    """
    if arr1.shape != arr2.shape:
        raise Exception("数据维度不同")
    return numpy.sum(arr1 * arr2)


# 5
def function5(number: int) -> None:
    """
    :param number: 测试次数
    :return:
    """
    cost1 = []
    cost2 = []
    for i in range(number):
        start = time.time()
        a, b = function1(i)
        res = function2(a, b)
        end = time.time()
        cost1.append(end - start)
    for i in range(number):
        start = time.time()
        a, b = function3(i)
        res = function4(a, b)
        end = time.time()
        cost2.append(end - start)
    x = [i for i in range(number)]
    fig = plt.figure()
    ax = plt.subplot(111)
    ax.plot(x, cost1, c='y', label='list')
    ax.plot(x, cost2, c='b', label='np.array')
    plt.legend()
    plt.show()


if __name__ == '__main__':
    function5(100)
import time
import random
import numpy as np
import matplotlib.pyplot as plt
def get_list(n):
return random.sample(range(1, n *10 ), k = n), random.sample(range(1, n *10 ), k = n)
list1, list2 = get_list(10)
print(list1, list2)
def lst_dotmul(lst1, lst2):
if lst1 and lst2:
if len(lst1) == len(lst2):
return sum(map(lambda x, y: x *y, lst1, lst2))
res = lst_dotmul([1, 2, ], [4, 6])
print(res)
def get_array(n):
return np.random.randint(1, n *10, n), np.random.randint(1, n *10, n)
arr1, arr2 = get_array(10)
print(arr1, arr2)
def arr_dotmul(arr1, arr2):
if arr1.any() and arr2.any() :
if len(arr1) == len(arr2):
return np.dot(arr1, arr2)
arr = arr_dotmul(np.array([]), arr2)
print(arr)
def get_time(size, flag ='lst'):
x_size = range(size, size + 100)
y_time = []
for i in x_size:
t1 = time.time()
if flag == 'lst':
lst1 , lst2 = get_list(i)
lst_dotmul(lst1, lst2)
else:
arr1, arr2 = get_array(i)
arr_dotmul(arr1, arr2)
t2 = time.time()
y_time.append(int((t2 - t1) *10000))
return x_size, y_time
x, y = get_time(1000)
x1, y1 = get_time(1000, 'arr')
plt.rcParams['font.family'] = 'SimHei'
plt.subplot(1, 2, 1)
plt.title("列表情况")
plt.plot(x, y)
plt.xlabel('数据规模')
plt.ylabel('时间(秒)*10000')
plt.subplot(1, 2, 2)
plt.title("数组情况")
plt.plot(x1, y1)
plt.xlabel('数据规模')
#如果做到一张图上,可以用下面的,结果如图2
plt.rcParams['font.family'] = 'SimHei'
plt.title("性能对比")
plt.plot(x, y, color = 'red', label = '列表[random库]')
plt.plot(x1, y1, color = 'blue', label = '数组[numpy库]')
plt.xlabel('数据规模')
plt.ylabel('时间(秒)*10000')
plt.legend()
plt.show()