在matlab中把超过阈值的区域用线标出来
想把超过阈值的区域标出来
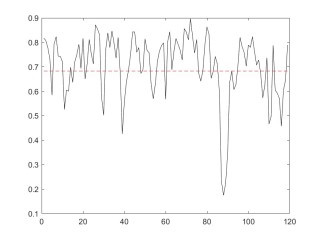
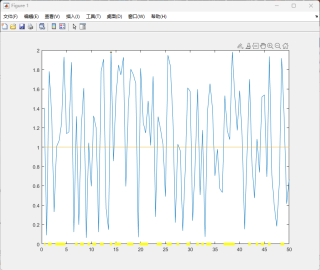
红色线为阈值线,黑色线为数据
nn=find(Ava_Matrix>=beta_th);% 黑色线数据存储在工作区Ava_Matrix中,beta_th为阈值
mn=nn(:);
plot([mn,mn],[1.2,1.2],'r','LineStyle','-','LineWidth',0.1);
我想的思路是把超出的部分对应的横坐标都找出来 然后画线 但是出的图是一片空白……(接触matlab不久!求指教)
最终想实现下面的效果
(主要是想把黄色线画出来)
求大家指教!感谢!
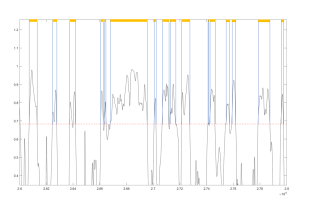
挺有意思的,简单试了下,应该可以满足你的需求,但还有很多可以改进的地方。
x = 0.5:0.5:50;
y = 2*rand(1,100);
v = 1;
plotAreaOverV(x, y, v);

function plotAreaOverV(x, y, v)
lineY=0;%黄色线所在位置

plot(x,y);
hold on
plot(x, v*ones(size(x,2)));%画出阈值线

areaOverX = find(y>v);%获得大于阈值的数据所在位置
startp = areaOverX(1);
startx = x(startp);
endp = areaOverX(1);
endx = x(endp);

for i=2:size(areaOverX,2)
    if areaOverX(i)-endp <= 1 %前后数据相邻
        endp = areaOverX(i);
        endx = x(endp);
    else
        hold on;
        dstartx = (x(max(startp-1,1)) - startx)/2; %起始点向前移动半个单位
        dendx = (x(min(startp+1,size(x,2))) - endx)/2;%结束点向后移动半个单位
        plot([startx+dstartx endx+dendx],[lineY lineY],Color='y',LineWidth=5);%画出前一段连续数据
        startp = areaOverX(i);
        startx = x(startp);
        endp = areaOverX(i);
        endx = x(endp);
    end
end

%画出最后一段线
dstartx = x(max(startp-1,1)) - startx;
dendx = x(min(startp+1,size(x,2))) - endx;
plot([startx+dstartx/2 endx+dendx/2],[lineY lineY],Color='y',LineWidth=5);

end