plt.subplot 画图只能是虚线
我用 matplotlib 的 plt.subplot 画子图,但只能画出虚线
import matplotlib.pyplot as plt
import numpy as np

plt.rcParams['font.sans-serif'] = ['SimHei']  # 显示中文
plt.rcParams['axes.unicode_minus'] = False  # 显示正负号

index = np.linspace(1, 10, 100)
data1 = np.sin(index)
data2 = np.cos(index)

fig = plt.figure(figsize=(16, 12))  # 创建画布

plt.subplot(121)  # 1行2列的图1
plt.plot(index, data1, 'r')

plt.subplot(122)  # 1行2列的图2
plt.plot(index, data2, 'g')

plt.show()
结果是这样的:
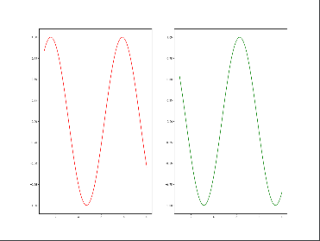
我更改过 ls 属性,但是不行。丹巴图片保存到桌面,在桌面看是好的。
- 这篇文章讲的很详细,请看:plt.subplot()函数解析(最清晰的解释)