如何用DBSCAN算法对时间序列的异常数据清洗?(语言-python)
问题遇到的现象和发生背景
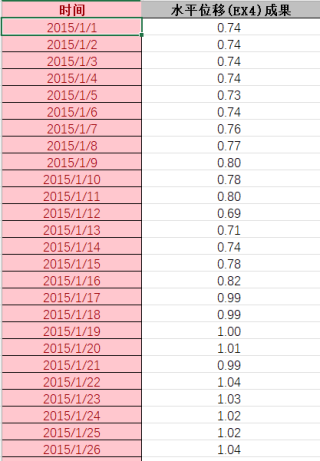
①如何用DBSCAN算法对时间序列的异常数据清洗呢?我的数据格式如下图:(请问需要把日期型变量转为数值型吗?怎么实现呢)
问题相关代码,请勿粘贴截图
②下面是我找到的DBSCAN算法相关代码,原码是从txt文件中输入数据,请问如果我要从我的excel输入数据应该改哪里呢?
import numpy as np
import matplotlib.pyplot as plt
import math
import time
UNCLASSIFIED = False
NOISE = 0
def loadDataSet(fileName, splitChar='\t'):#定义一个两参数的函数
"""
输入:文件名
输出:数据集
描述:从文件读入数据集
"""
dataSet = [] #创建一个空列表
with open(fileName) as fr:#打开文件赋给fr
for line in fr.readlines():#将文本文件每一行都作为独立的字符串对象并将这些对象放入列表返回。遍历给line
curline = line.strip().split(splitChar)#strip()如果不带参数,默认是清除两边的空白符,split(splitChar)
#将line字符串按照splitChar='\t'切分成多个字符串存在一个列表中,赋给curline
fltline = list(map(float, curline))#切分出的列表的每个值,用float函数把它们转成float型, list()函数把map函数返回的迭代器遍历展开成一个列表赋给fltline
dataSet.append(fltline)#添加到之前创建的空列表dataSet里
return dataSet
def dist(a, b):
"""
输入:向量A, 向量B
输出:两个向量的欧式距离
"""
return math.sqrt(np.power(a - b, 2).sum())
def eps_neighbor(a, b, eps):
"""
输入:向量A, 向量B
输出:是否在eps范围内
"""
return dist(a, b) < eps
def region_query(data, pointId, eps):
"""
输入:数据集, 查询点id, 半径大小
输出:在eps范围内的点的id
"""
nPoints = data.shape[1]
seeds = []
for i in range(nPoints):
if eps_neighbor(data[:, pointId], data[:, i], eps):
seeds.append(i)
return seeds
def expand_cluster(data, clusterResult, pointId, clusterId, eps, minPts):
"""
输入:数据集, 分类结果, 待分类点id, 簇id, 半径大小, 最小点个数
输出:能否成功分类
"""
seeds = region_query(data, pointId, eps)
if len(seeds) < minPts: # 不满足minPts条件的为噪声点
clusterResult[pointId] = NOISE
return False
else:
clusterResult[pointId] = clusterId # 划分到该簇
for seedId in seeds:
clusterResult[seedId] = clusterId
    while len(seeds) > 0: # 持续扩张
        currentPoint = seeds[0]
        queryResults = region_query(data, currentPoint, eps)
        if len(queryResults) >= minPts:
            for i in range(len(queryResults)):
                resultPoint = queryResults[i]
                if clusterResult[resultPoint] == UNCLASSIFIED:
                    seeds.append(resultPoint)
                    clusterResult[resultPoint] = clusterId
                elif clusterResult[resultPoint] == NOISE:
                    clusterResult[resultPoint] = clusterId
        seeds = seeds[1:]
    return True
def dbscan(data, eps, minPts):
"""
输入:数据集, 半径大小, 最小点个数
输出:分类簇id
"""
clusterId = 1
nPoints = data.shape[1]
clusterResult = [UNCLASSIFIED] * nPoints
for pointId in range(nPoints):
point = data[:, pointId]
if clusterResult[pointId] == UNCLASSIFIED:
if expand_cluster(data, clusterResult, pointId, clusterId, eps, minPts):
clusterId = clusterId + 1
return clusterResult, clusterId - 1
def plotFeature(data, clusters, clusterNum):
nPoints = data.shape[1]
matClusters = np.mat(clusters).transpose()
fig = plt.figure()
scatterColors = ['black', 'blue', 'green', 'yellow', 'red', 'purple', 'orange', 'brown']
ax = fig.add_subplot(111)
for i in range(clusterNum + 1):
colorSytle = scatterColors[i % len(scatterColors)]
subCluster = data[:, np.nonzero(matClusters[:, 0].A == i)]
ax.scatter(subCluster[0, :].flatten().A[0], subCluster[1, :].flatten().A[0], c=colorSytle, s=50)
def main():
dataSet = loadDataSet('788points.txt', splitChar=',')
dataSet = np.mat(dataSet).transpose()
# print(dataSet)
clusters, clusterNum = dbscan(dataSet, 2, 3)
print("cluster Numbers = ", clusterNum)
# print(clusters)
count=0 # Modified_用于将结果输出到文件
m=open('788points.txt').read().splitlines() # Modified_用于将结果输出到文件
out=open('788points_DBSCAN.txt','w') # Modified_用于将结果输出到文件
for n in m: # Modified_用于将结果输出到文件
out.write(n+',{0}\n'.format(clusters[count]))
count+=1
out.close() # Modified_用于将结果输出到文件
plotFeature(dataSet, clusters, clusterNum)
if name == 'main':
start = time.process_time() # Modified_将time.clock()替换为time.process_time()
main()
end = time.process_time() # Modified_将time.clock()替换为time.process_time()
print('finish all in %s' % str(end - start))
plt.show()
运行结果及报错内容
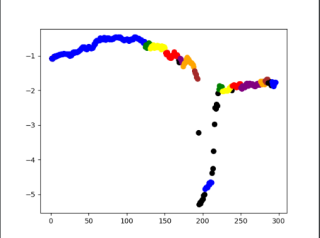
③下面是我用这个代码运行出来的结果:因为前面提到的不知道怎么把日期型改成数值型,我把时间改成了123456...不知道对不对。(调了很久那两个参数),我感觉下面的点应该都是黑色(噪声点)才对,可是就是调不出这种效果来该怎么办?
④还有一个问题就是这行代码scatterColors = ['black', 'blue', 'green', 'yellow', 'red', 'purple', 'orange', 'brown'] dbscan是自动分类的(事先不知道分几类),为什么这里可以提前指定分8类颜色呢?
我的解答思路和尝试过的方法
我想要达到的结果
时间应该是横轴吧,这个不用输入吧,用数据去建模吧;如果非要用那就映射成数字吧。
先交流一下,首先提个建议,你应该把代码用代码块的方式提交,现在这格式别人要帮你调代码抄都得抄好久,还格式容易错,你用插入代码块的方式提交会减少很多麻烦
1、你所谓的数据清洗是时间格式异常还是数据异常一伙是其他问题,建议你给个具体的异常例子
2、txt到excel的转换比较容易,用pandas的read_excel函数读取表格数据,然后把内容处理成需要的格式就行
3、因为你现在代码结构比较乱,也没有数据,所以不确定你的时间处理方式是否合理
4、8种颜色只是预设,我大概浏览了一下代码,好像是后续进行颜色循环来着,也就是说如果有9类,那么第9类就会循环为黑色,以此类推