python,turtle模块
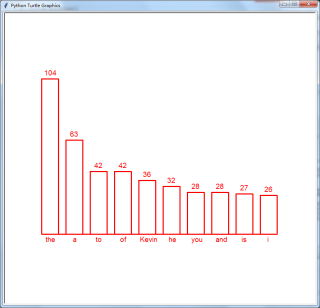
使用turtle模块绘制词频统计结果,其中词频数据
wordFrequency=
{"the":104,"a":63,"to":42,"of":42,"Kevin":36,"he":32,"you":28,"and":28,"is":27,"i":26}
以柱状图的形式展示统计结果。
如下所示,主要在遍历字典时要凑好坐标位置有点麻烦:
import turtle

t = turtle.Pen()

t.color("red")
t.pensize(3)
t.speed(0)

wordFrequency = {"the":104,"a":63,"to":42,"of":42,"Kevin":36,"he":32,"you":28,"and":28,"is":27,"i":26}

def Goto(x,y):
    t.penup()
    t.goto(x,y)
    t.pendown()

def rect(x,y,h,w=45):
    Goto(x,y)
    for i in range(2):
        t.forward(w)
        t.left(90)
        t.forward(h)
        t.left(90)
        t.fillcolor('red')

start_x , start_y = -320, -200
Goto(start_x , start_y)
t.forward(630)

for i,d in enumerate(wordFrequency.items()):
    rect(start_x + i*65, start_y ,d[1]*4 )
    tx = t.xcor()
    Goto(tx+(6-len(d[0]))*4, t.ycor()-25)
    t.write(d[0], font=('Arial',14,'normal'))
    Goto(tx + (8 if d[1]>100 else 12), t.ycor()+d[1]*4+30)
    t.write(d[1], font=('Arial',14,'normal'))

t.hideturtle()
t.done()