项目里使用echart作图,可以做出曲线但是却一直无法实现面积图效果

这个是图表模块

mixLineBar: function (opts) {
                var option = {
                    grid: {
                        y: '10%', //y代表了图表体和legend的距离
                        borderWidth: 0
                    },
                    color: ['#66b7ef', '#fa8564', '#50d1ae', '#e492d0'],
                    tooltip: {
                            trigger: 'axis',
                            axisPointer: {
                                type: 'cross',
                                crossStyle: {
                                    color: '#999'
                                }
                            }
                        },
                        legend: {
                            data: opts.legendData
                        },
                        xAxis: [{
                            type: 'category',
                            data: opts.xAxisData,
                            axisPointer: {
                                type: 'shadow'
                            },
                            splitLine:{show:false},
                            axisTick:{show:false},
                            axisLine: {
                                lineStyle: {
                                    color: '#58676d',
                                    width: 1
                                }
                            },
                        }],
                        yAxis: [{
                            type: 'value',
                            name: '增长率',
                            interval: 50,
                            axisLine: {
                                lineStyle: {
                                    color: '#58676d',
                                    width: 1
                                }
                            },
                            splitLine:{show:false}
                        },
                        {
                            type: 'value',
                            name: '占比',
                            axisLabel: {
                                formatter: '{value} %'
                            },
                                axisLine:{
                                    lineStyle:{
                                        color: '#58676d',
                                        width:1
                                    }
                                },
                                splitLine:{show:false}
                            }
                        ],
                        series: [{
                                name: opts.legendData[0],
                                type: 'line',
                                /*smooth: true,*/
                                yAxisIndex: 1,
                                data: opts.addData,
                                areaStyle: {}
                            },
                            {
                                name: opts.legendData[1],
                                type: 'line',
                                smooth: true,
                                data: opts.liveData,
                            }
                        ]
                }
                return option;
            }

这个是json格式

"mendNum": {
    "legendData":["月增长率","月报修次数"],
    "xAxisData": ["1月", "2月", "3月", "4月", "5月", "6月", "7月", "8月", "9月", "10月", "11月", "12月"],
    "addData":[175, 30, 28, 100, 75, 150, 25, 5, 75, 10,50,25],
    "liveData":[400, 1000, 700, 500, 900, 300, 600, 500, 400, 800,1000,500]
    },

数据什么的都能对应上,在项目里的效果如下
图片说明

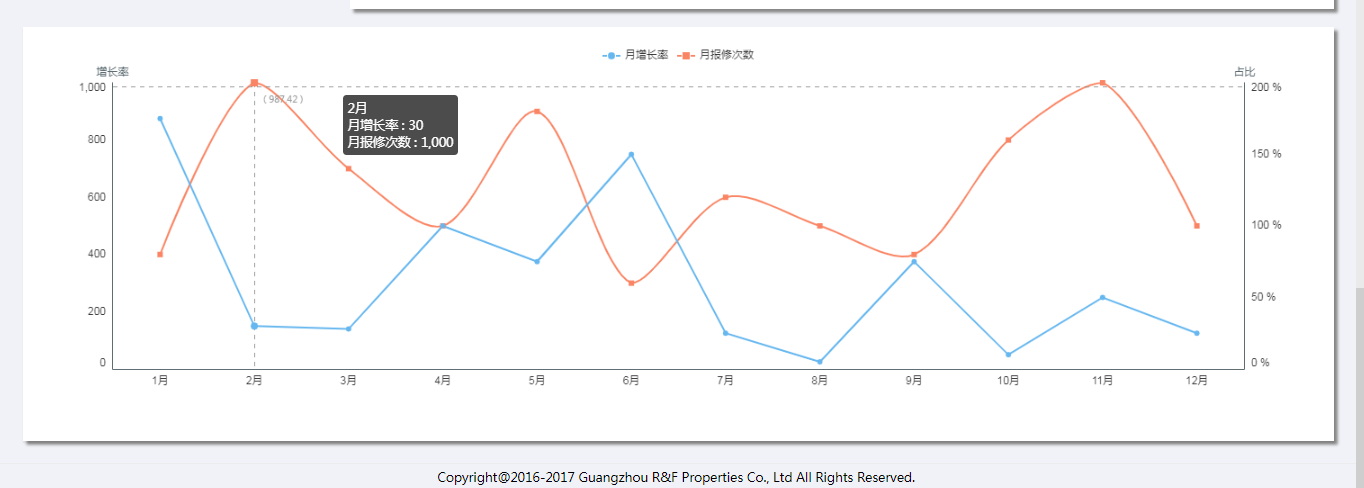
我想让第一条线变成下面全部会被染色的面积图效果,官网实例是给series添加空的areastyle效果就行了,但我加了也没用啊。。求教为什么

series中加试试

itemStyle: {
        normal: {
                color: '#289df5', // 折线条的颜色
                borderColor: '#289df5', // 拐点边框颜色
                areaStyle: {
                        type: 'default',
                        opacity: 0.1
                }
        }
}

看下有没有js报错啥的. 我用你的代码是有面积图的图片说明

图片说明
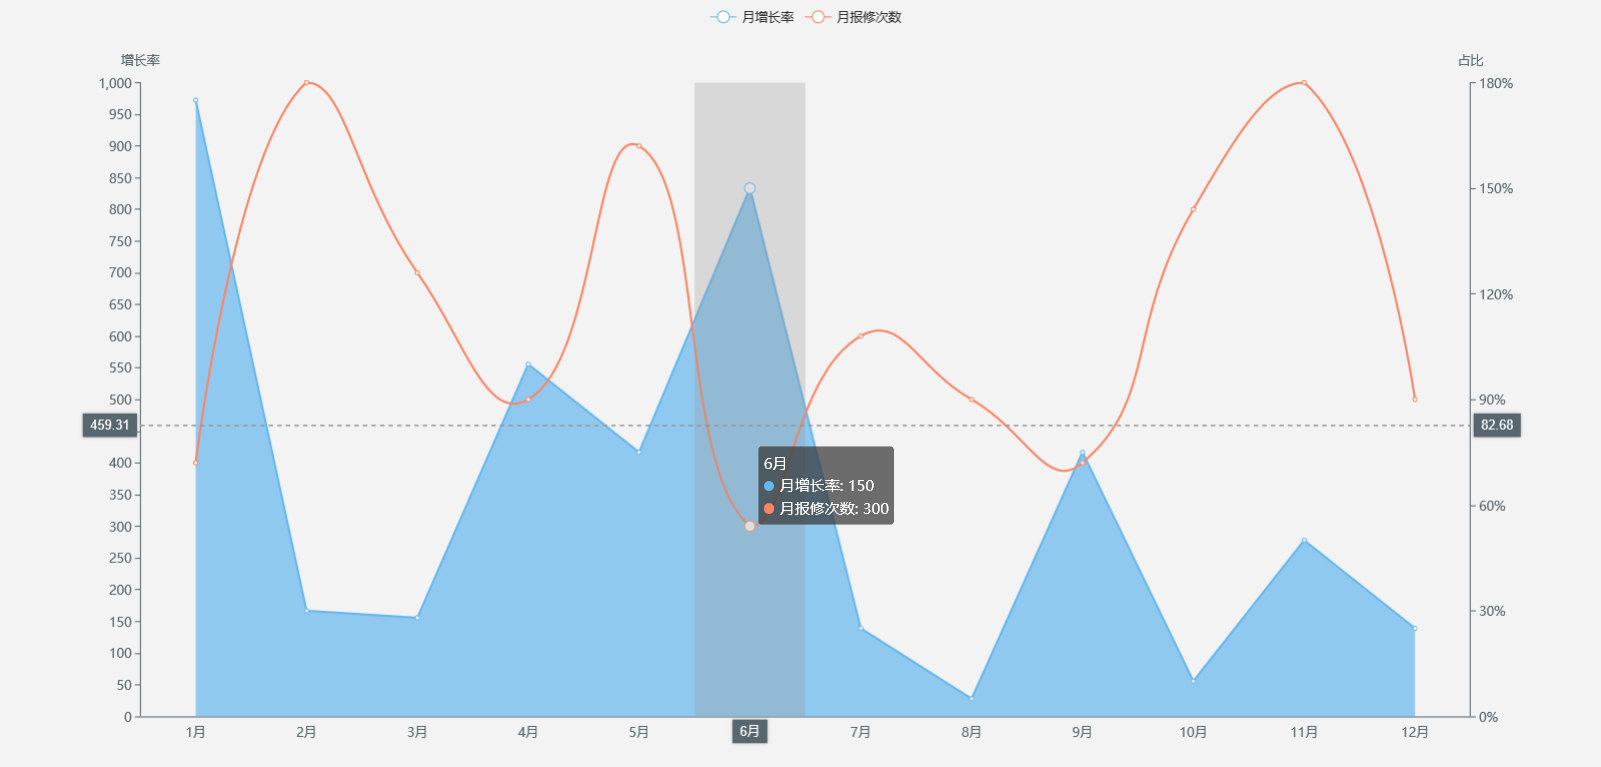
我用你的代码试的也是好的,可以清一下缓存试试

换个浏览器试试,勾上disable cache 看看有没有报错。可能资源加载有问题