关于python matplotlib的问题
import matplotlib.pyplot as plt
import numpy as np
bar_width = 0.4
plt.bar(left = np.arange(len(school)),height = group_ms,label = 'MS', color = 'steelblue',width = bar_width)
plt.bar(left = np.arange(len(school))+bar_width,height = group_gp,label = 'GP', color = 'indianred',width = bar_width)
plt.xticks(np.arange(3)+0.2,school)
plt.legend()
plt.show()
错误代码是:
TypeError                                 Traceback (most recent call last)
<ipython-input-80-f63fd0192e45> in <module>
      2 import numpy as np
      3 bar_width = 0.4
----> 4 plt.bar(left = np.arange(len(school)),height = group_ms,label = 'MS', color = 'steelblue',width = bar_width)
      5 plt.bar(left = np.arange(len(school))+bar_width,height = group_gp,label = 'GP', color = 'indianred',width = bar_width)
      6 plt.xticks(np.arange(3)+0.2,school)

TypeError: bar() missing 1 required positional argument: 'x'
数据是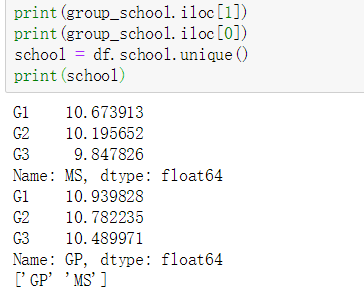
需要将两个学校的数据进行对比
把plt.bar 中的left 换成x就可以了
plt.bar(left = np.arange(len(school)),height = group_ms,label = 'MS', color = 'steelblue',width = bar_width) X轴没有给参数
import numpy as np
import pandas as pd
import matplotlib.pyplot as plt
生成x轴上的数据:从-3到3,总共有50个点
x = np.linspace(-1, 1, 50)
定义一个线性方程
y1 = 2 * x + 1
定义一个二次方程
y2 = x ** 2
设置x轴的取值范围为:-1到2
plt.xlim(-1, 2)
设置y轴的取值范围为:-1到3
plt.ylim(-1, 3)
设置x轴的文本,用于描述x轴代表的是什么
plt.xlabel("I am x")
设置y轴的文本,用于描述y轴代表的是什么
plt.ylabel("I am y")
plt.plot(x, y2)
绘制红色的线宽为1虚线的线条
自己套一下