matplotlib.pyplot不出图。但是可以正常运行,win10
matplotlib.pyplot不出图,能正常运行但是不出图
import matplotlib.pyplot as plt
def visualizeModel(x,y,ols,lad):
fig= plt.figure(figsize=(12,6),dpi=80)
ax2= fig.add_subplot(121)
ax3= fig.add_subplot(122)
ax2.set_xlabel("$x$")
ax2.set_xticks(range(0,250000,25000))
ax2.set_ylabel("$y$")
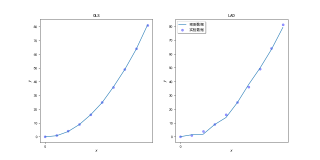
ax2.set_title('OLS')
ax3.set_xlabel("$x$")
ax3.set_xticks(range(0, 250000, 25000))
ax3.set_ylabel("$y$")
ax3.set_title('LAD')
ax2.scatter(x,y, color= "b",alpha=0.4,label='实验数据')
ax2.plot(x,ols,label='预测数据')
ax3.scatter(x, y, color="b", alpha=0.4, label='实验数据')
ax3.plot(x,lad,label='预测数据')
plt.legend(shadow=True)
plt.show()
C:\pyanzhuang\envs\小白到专家\python.exe C:/Users/啦啦啦/PycharmProjects/小白到专家/7.2p140.py
进程已结束,退出代码0
我的解答思路和尝试过的方法
我想要达到的结果
加了兼容汉字的部分,感觉应该ax2, ax3分别调用legend
import matplotlib.pyplot as plt
def visualizeModel(x,y,ols,lad):
    fig= plt.figure(figsize=(12,6),dpi=80)
    ax2= fig.add_subplot(121)
    ax3= fig.add_subplot(122)
    ax2.set_xlabel("$x$")
    ax2.set_xticks(range(0,250000,25000))
    ax2.set_ylabel("$y$")
    ax2.set_title('OLS')
    ax3.set_xlabel("$x$")
    ax3.set_xticks(range(0, 250000, 25000))
    ax3.set_ylabel("$y$")
    ax3.set_title('LAD')
    ax2.scatter(x,y, color= "b",alpha=0.4,label='实验数据')
    ax2.plot(x,ols,label='预测数据')
    ax3.scatter(x, y, color="b", alpha=0.4, label='实验数据')
    ax3.plot(x,lad,label='预测数据')
    plt.legend(shadow=True)
    plt.show()

if __name__ == '__main__':
    import matplotlib as mpl
    import random

    mpl.rcParams['font.sans-serif']=['SimHei'] # 汉字兼容

    x = list(range(10))
    y = [i**2 for i in x]
    ols = [i - 0.5 + random.random() for i in y]
    lad = [i - (random.random() - 0.5) * 5 for i in y]

    visualizeModel(x, y, ols, lad)
定义了visualizeModel函数,却没有调用,只有最后一句plt.show运行了,自然不会有图,也没有错误。
正确用法
plt.plot(x,ols,label='预测数据')
望采纳