matlab求解二阶微分方程
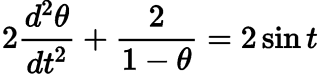
有hxd能教教me怎么解类似于这种微分方程嘛,得到θ关于t的曲线图嘛,θ范围(7°-10°)
可以的
odefun = @(t,x) [x(2); sin(t)-1/(1-x(1))];
x0 = [0; 0]; % 比方说x0都是0
[t, y] = ode45(odefun, [0,10], x0);
plot(t, y)
legend('\theta', '\theta''')
你用的matlab的版本?
有hxd能教教me怎么解类似于这种微分方程嘛,得到θ关于t的曲线图嘛,θ范围(7°-10°)
可以的
odefun = @(t,x) [x(2); sin(t)-1/(1-x(1))];
x0 = [0; 0]; % 比方说x0都是0
[t, y] = ode45(odefun, [0,10], x0);
plot(t, y)
legend('\theta', '\theta''')
你用的matlab的版本?