echart的雷达图
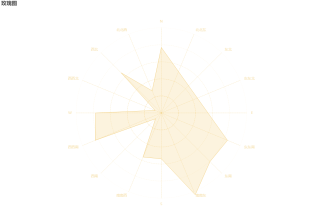
我用echart做了这样的一个图,想要请问如何让这个文字,只显示wsne这四个字母,而不显示东东南等词呢?不能把她们删除,因为tooiltip提示框需要把所有名称都显示出来,删除的话提示框也不会有了
option = {
  title: {
    text: '玫瑰图'
  },
  tooltip: {
        show: true,
        textStyle:{
          color :'#fff'

        },
         backgroundColor  :'rgba(0,0,0,0.7)'
    },
  legend: {
    data: ['风速玫瑰图'],
    show: false, //不显示图例,

  },
  radar: {
    shape: 'circle',
    axisName: {
      // color: 'rgba(238, 197, 102,1)' //标签的样式
      lineStyle:{color: [
          'rgba(238, 197, 102, 0)',
          'rgba(238, 197, 102, 0)',
          'rgba(238, 197, 102, 0.4)',
          'rgba(238, 197, 102, 0.6)',
          'rgba(238, 197, 102, 0.8)',
          'rgba(238, 197, 102, 0.4)',
          'rgba(238, 197, 102, 0.6)',
          'rgba(238, 197, 102, 0.8)',
          'rgba(238, 197, 102, 102)',
          'rgba(238, 197, 102, 0)',
          'rgba(238, 197, 102, 0)',
          'rgba(238, 197, 102, 0)',
          'rgba(238, 197, 102, 0)',
          'rgba(238, 197, 102, 0)',
          'rgba(238, 197, 102, 0)',
          'rgba(238, 197, 102, 0)'
        ].reverse(),
    }},
    splitLine: {
      lineStyle: {
        color: [
          'rgba(238, 197, 102, 0.1)',
          'rgba(238, 197, 102, 0.2)',
          'rgba(238, 197, 102, 0.4)',
          'rgba(238, 197, 102, 0.6)',
          'rgba(238, 197, 102, 0.8)',
          'rgba(238, 197, 102, 1)'
        ].reverse(),
        type:"dashed"//虚线
      } //每层圆圈的样式
    },
    splitArea: {
      show: false //不显示划分每个区域的样式
    },
    indicator: [
      { name: 'N', max: 6500 },
      { name: '北北西', max: 16000 },
      { name: '西北', max: 30000 },
      { name: '西西北', max: 38000 },
      { name: 'W', max: 52000 },
      { name: '西西南', max: 25000 },
       { name: '西南', max: 52000 },
      { name: '南南西', max: 25000 },
       { name: 'S', max: 52000 },
      { name: '南南东', max: 25000 },
       { name: '东南', max: 52000 },
      { name: '东东南', max: 25000 },
       { name: 'E', max: 52000 },
      { name: '东东北', max: 25000 },
       { name: '东北', max: 52000 },
      { name: '北北东', max: 25000 }
    ],
    axisLine: {
      lineStyle: {
        color: 'rgba(238, 197, 102, 0.5)', //由圆点往外的线的样式
        type:"dashed"//虚线

      }
    }
  },
  series: [
    {
      name: 'Budget vs spending',
      type: 'radar',
      data: [
        {
          value: [5000, 4500, 20000, 3000, 40089, 21000,5000, 14000, 28000, 26000, 42000, 21000],
          name: '风速玫瑰图'
        }
      ],
      itemStyle: {
        color: 'rgb(238, 197, 102)' //线的样式
      },
      areaStyle: {
        color: 'rgba(238, 197, 102,0.3)'
      },
      lineStyle: {//线的长度
        width: 1,
        // opacity: 0.5
      },
      symbol: 'none',//让拐点消失

    }
  ]
};
    option = {
      title: {
        text: '玫瑰图'
      },
      tooltip: {
            show: true,
            textStyle:{
              color :'#fff'

            },
             backgroundColor  :'rgba(0,0,0,0.7)',
             formatter:(e)=>{
                 let value=e.data.value;
                 let str=``;
                 let name= ['N','北北西','西北','西西北', 'W', '西西南',  '西南','南南西', 'S', '南南东', '东南','东东南', 'E','东东北', '东北','北北东',
]
                 value.forEach((item,index)=>{
                     str+=`<span>${name[index]}:${item}</span><br/>`
                 })
                 return str;
             }
        },
      legend: {
        data: ['风速玫瑰图'],
        show: false, //不显示图例,

      },
      radar: {
        shape: 'circle',
        axisName: {
          // color: 'rgba(238, 197, 102,1)' //标签的样式
          lineStyle:{color: [
              'rgba(238, 197, 102, 0)',
              'rgba(238, 197, 102, 0)',
              'rgba(238, 197, 102, 0.4)',
              'rgba(238, 197, 102, 0.6)',
              'rgba(238, 197, 102, 0.8)',
              'rgba(238, 197, 102, 0.4)',
              'rgba(238, 197, 102, 0.6)',
              'rgba(238, 197, 102, 0.8)',
              'rgba(238, 197, 102, 102)',
              'rgba(238, 197, 102, 0)',
              'rgba(238, 197, 102, 0)',
              'rgba(238, 197, 102, 0)',
              'rgba(238, 197, 102, 0)',
              'rgba(238, 197, 102, 0)',
              'rgba(238, 197, 102, 0)',
              'rgba(238, 197, 102, 0)'
            ].reverse(),
        }},
        splitLine: {
          lineStyle: {
            color: [
              'rgba(238, 197, 102, 0.1)',
              'rgba(238, 197, 102, 0.2)',
              'rgba(238, 197, 102, 0.4)',
              'rgba(238, 197, 102, 0.6)',
              'rgba(238, 197, 102, 0.8)',
              'rgba(238, 197, 102, 1)'
            ].reverse(),
            type:"dashed"//虚线
          } //每层圆圈的样式
        },
        splitArea: {
          show: false //不显示划分每个区域的样式
        },
        indicator: [
          { name: 'N', max: 6500 },
          { name: '', max: 16000 },
          { name: '', max: 30000 },
          { name: '', max: 38000 },
          { name: 'W', max: 52000 },
          { name: '', max: 25000 },
           { name: '', max: 52000 },
          { name: '', max: 25000 },
           { name: 'S', max: 52000 },
          { name: '', max: 25000 },
           { name: '', max: 52000 },
          { name: '', max: 25000 },
           { name: 'E', max: 52000 },
          { name: '', max: 25000 },
           { name: '', max: 52000 },
          { name: '', max: 25000 }
        ],
        axisLine: {
          lineStyle: {
            color: 'rgba(238, 197, 102, 0.5)', //由圆点往外的线的样式
            type:"dashed"//虚线

          }
        }
      },
      series: [
        {
          name: 'Budget vs spending',
          type: 'radar',
          data: [
            {
              value: [5000, 4500, 20000, 3000, 40089, 21000,5000, 14000, 28000, 26000, 42000, 21000],
              name: '风速玫瑰图'
            }
          ],
          itemStyle: {
            color: 'rgb(238, 197, 102)' //线的样式
          },
          areaStyle: {
            color: 'rgba(238, 197, 102,0.3)'
          },
          lineStyle: {//线的长度
            width: 1,
            // opacity: 0.5
          },
          symbol: 'none',//让拐点消失

        }
      ]
    };
在tooltip中设置一下就可以了,至于样式的话,自己自定义一下,我这里简单写了一下,你自己修改成你自己需要的

这是我写的雷达图,上面的文字是根据你数据来的,代码仅供你参考
 var option = {
            tooltip: {
                trigger: 'item',
                show: false
            },
            grid: {
                top: chartsRelativeSize(2.5, 'h'),
                left: 0,
                right: chartsRelativeSize(0.1, 'r'),
                bottom: chartsRelativeSize(1.29, 'h'),
                containLabel: true//容器内全部显示
            },
            legend: {
                show: true,
                orient: 'vertical',
                itemWidth: chartsRelativeSize(0.5, 'r'),
                itemHeight: chartsRelativeSize(1, 'h'),
                itemGap: chartsRelativeSize(1, 'h'),
                top: chartsRelativeSize(0, 'h'),
                right: 0,
                data: ["同案同室看管", "临时出区超时", "特殊身份嫌疑人", "随身物品未接发还", "单人讯问", "无人看管", "未进入办案区"],
                textStyle: {
                    fontSize: chartsRelativeSize(0.7, 'r'),
                    color: '#f9fffb'
                }
            },
            radar: [
                {
                    indicator: [
                        {text: '同案同室看管', value: '321'},
                        {text: '临时出区超时', value: '3422'},
                        {text: '特殊身份嫌疑人', value: '4452'},
                        {text: '随身物品未接发还', value: '1232'},
                        {text: '单人讯问', value: '2312'},
                        {text: '无人看管', value: '1342'},
                        {text: '未进入办案区', value: '2341'},
                    ],
                    radius: '60%',
                    startAngle: 140,
                    splitNumber: 4,
                    shape: 'circle',
                    name: {
                        formatter: function (value, ind) {
                            return '{a|' + value + '}:{b|' + ind.value + '}'
                        },
                        textStyle: {
                            color: '#ffffff',
                            fontSize: chartsRelativeSize(0.7, 'r')

                        },
                        rich: {
                            a: {
                                color: '#fff',
                                align: 'center',
                                fontSize: chartsRelativeSize(0.7, 'r')
                            },
                            b: {
                                color: '#ffc72b',
                                align: 'center',
                                fontSize: chartsRelativeSize(0.7, 'r'),
                                fontWeight: 'bold',
                            }
                        }
                    },
                    splitArea: {
                        show: false
                    },
                    axisLine: {
                        lineStyle: {
                            color: 'rgb(23,72,136)',
                            type: 'dashed'
                        }
                    },
                    splitLine: {
                        lineStyle: {
                            width: chartsRelativeSize(0.2, 'h'),
                            color: 'rgb(23,72,136)',
                            type: 'dashed'
                        }
                    }
                }
            ],
            series: [
                {
                    type: 'radar',
                    symbol: 'circle',
                    symbolSize: 4,
                    itemStyle: {
                        color: '#2882b7',
                        borderColor: 'rgba(44,241,142,0.3)',
                        borderWidth: 4,
                        emphasis: {
                            // color: 各异,
                            lineStyle: {
                                width: chartsRelativeSize(0.2, 'h')
                            }
                        }
                    },
                    data: [
                        {
                            value: [321, 3422, 4452, 1232, 2312, 1342, 2341],
                            name: '单位排名',
                            lineStyle: {
                                type: 'dashed'
                            },
                            itemStyle: {
                                color: '#174888'
                            },
                            areaStyle: {
                                opacity: 0.5
                            }
                        },

                    ]

                }
            ]
        }