matlab movie运行后出现问题
问题遇到的现象和发生背景
运行图像没有问题、但在运行后matlab2020a报错
想请问一下怎么解决这个报错。
问题相关代码,请勿粘贴截图
clear;
dx=0.01; Imax=100; nmax=500;
c=3e8; omega=2*pi*300e6; dt=dx/c;
x=linspace(dx,Imax*dx,Imax);  % 二维情况,请使用meshgrid生成网格。[x,y]=meshgrid(....)
ii=1:Imax;
f1(1:Imax)=sin(ii*dx); %二维情况,f1是个二维函数。
plot(x,f1)
ylabel('f1');
M=moviein(nmax/2,gcf);
%***********************************************************************
%     BEGIN TIME-STEPPING LOOP
%***********************************************************************
for n=1:nmax
%***********************************************************************
%     Update sin(wt-x)
%***********************************************************************
f1(1:Imax)=sin(omega*n*dt-ii*dx);
%***********************************************************************
%     Visualize fields
%***********************************************************************
if mod(n,2)==0
rtime=num2str(round(n*dt/1.0e-9));
plot(f1) %二维情况,请使用mesh画图,mesh(f1)
title(['time = ',rtime,' ns']);
ylabel('f1');
M(:,n/2)=getframe(gcf);
end
%***********************************************************************
%     END TIME-STEPPING LOOP
%***********************************************************************
end
movie(M)[]([]())
运行结果及报错内容
运行图像没有问题但命令行窗口报错
具体如下:
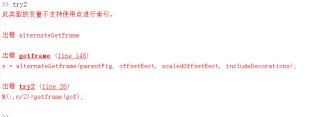
此类型的变量不支持使用点进行索引。
出错 alternateGetframe
出错 getframe (line 148)
x = alternateGetframe(parentFig, offsetRect, scaledOffsetRect, includeDecorations);
出错 try2 (line 26)
M(:,n/2)=getframe(gcf);
Matlab 2020b运行没问题,可以正常出动画效果。可以加断点调试,看看getframe(gcf)的数据类型。

% --- Executes on button press in pushbutton1.
function pushbutton1_Callback(hObject, eventdata, handles)
% hObject    handle to pushbutton1 (see GCBO)
% eventdata  reserved - to be defined in a future version of MATLAB
% handles    structure with handles and user data (see GUIDATA)
if handles.c==1
    clear;
    dx=0.01; Imax=100; nmax=500;
    c=3e8; omega=2*pi*300e6; dt=dx/c;
    x=linspace(dx,Imax*dx,Imax);  % 二维情况,请使用meshgrid生成网格。[x,y]=meshgrid(....)
    ii=1:Imax;
    f1(1:Imax)=sin(ii*dx); %二维情况,f1是个二维函数。
    plot(x,f1)
    ylabel('f1');
    M=moviein(nmax/2,gcf);
    for n=1:nmax
    f1(1:Imax)=sin(omega*n*dt-ii*dx);
    if mod(n,2)==0;
    rtime=num2str(round(n*dt/1.0e-9));
    plot(f1) %二维情况,请使用mesh画图,mesh(f1)
    title(['time = ',rtime,' ns']);
    ylabel('f1');
    M(:,n/2)=getframe(gcf);
    end
    end
    movie(M);
else
    %clear;
    dx=0.01; dy=dx;
    Imax=100; Jmax=100; nmax=500;
    c=3e8; omega=2*pi*300e6; dt=dx/c;
    [x,y]=meshgrid(Imax*dx,Jmax*dy);
    ii=1:Imax; jj=1:Jmax;
    f1(1:Imax,1:Jmax)=sin(ii*dx)'*sin(jj*dy);
    mesh(f1);
    ylabel('f1');
    M=moviein(nmax/2,gcf);
    for n=1:nmax
    f1(1:Imax,1:Jmax)=sin(omega*n*dt-ii*dx)'*sin(omega*n*dt-jj*dy);
    if mod(n,2)==0;
    rtime=num2str(round(n*dt/1.0e-9));
    mesh(f1)
    title(['time = ',rtime,' ns']);
    ylabel('f1');
    M(:,n/2)=getframe(gcf);
    end
    end
    movie(M)
end
PS:问答VIP年卡 【限时加赠:IT技术图书免费领】,了解详情>>> https://vip.csdn.net/askvip?utm_source=1146287632