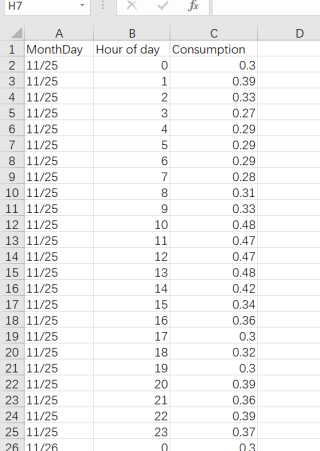
用python画折线图,现在有一个这种格式的excel表monthday, hours of day为x,comsumption为y请问一下如何在折线图的x轴上,上方显示日期,下方显示时间,谢谢
可以参考