Python使用matplotlib绘图如何对坐标轴刻度值缩放并改变e的次方?
大家好,
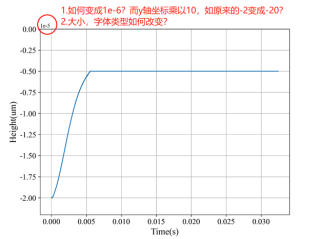
用matplotlib绘图出来如下,我想改变y轴坐标值表示方式,把整体y轴坐标值乘以10,然后顶部的1e-5变成1e-6,此外,顶部的科学计数法后半部分的字体大小和类型如何改变?
import numpy as np
import matplotlib.pyplot as plt
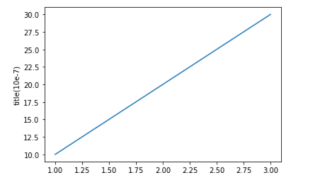
y_values = [1000000, 2000000, 3000000]
y_values2 = [t/10e4 for t in y_values] #重新计算
x_values = [1, 2, 3]
plt.plot(x_values, y_values2)
plt.ylabel('title(10e-7)')
plt.show()