Matplotlib 怎么让字符串坐标轴显示数据
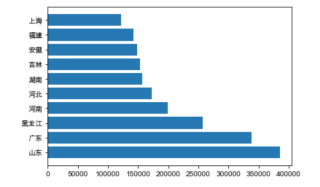
如图,想让条形图把具体数据显示出来,我的想法是用plt.text(),但是不知道怎么定位y的坐标,求解。
源码如下:
plt.barh(height=0.8,width=df5.values,y=df5.index)
可以参照如下代码。
import pandas as pd
import matplotlib.pyplot as plt
df=pd.DataFrame({'province':['sh','fj','hb','ah','gd'],'value':[65000,58560,38850,36010,68760]})
ax=plt.barh(height=0.6,width=df.value,y=df.province)
for i in range(len(df)):
    plt.text(df.value[i]+4000, df.province[i], str(df.value[i]),
             horizontalalignment='center', verticalalignment='center')
plt.xlim([0,80000])
plt.show()
结合大神给的回复,我使用了两种方法
首先要知道plt.text(x,y,s,ha='',va='')有三个必填参数x(横坐标的位置),y(纵坐标的位置),s(横纵坐标位置要显示的数据);ha(设置水平显示),va(设置垂直显示)。
方法一:使用for循环
plt.bar(x,y)
plt.barh(height=0.8,width=df5.values,y=df5.index)
for i in range(len(df5)):
    plt.text(df5.values[i],df5.index[i],df5.values[i],va='center')
结果如下:
方案二:使用for循环+zip()函数:
x = df5.values
y = df5.index
plt.barh(height=0.8,width=df5.values,y=df5.index)
for a,b in zip(x,y):
    plt.text(a,b,a,va='center')
结果如下: