echarts地图点击后放大过渡动画
各位大神们求帮助。现在遇到一个需求是:
echarts渲染出的地图,当点击某一块地图区域时,放大该区域。
现在已经实现了放大效果,通过修改地图的center和zoom属性实现的,但是没有过渡动画,求帮助。
$.get(countriesJson, function (geoJson) {
        CountriesChart.hideLoading();
        echarts.registerMap('World', geoJson);
        CountriesChart.setOption(option = {
            tooltip: {
                trigger: 'item',
                formatter: '{b}<br/>指数:{c}'
            },
            visualMap: {
                type: "piecewise",
                splitNumber: 5,
                left: '30',
                bottom: '30',
                min: 0,
                max: 5,
                calculable: true,
                realtime: false,
                inRange: {
                    color: ["#5e2120", "#843433", "#ea835b", "#f3c097", "#ecd7a8"].reverse()
                }
            },
            series: [{
                name: '国家态势',
                type: 'map',
                mapType: 'World',
                zoom: 1,
                roam: true,
                scaleLimit: { //滚轮缩放的极限控制
                    min: 1,
                    max: 20
                },
                itemStyle: {
                    areaColor: '#eee',
                    emphasis: {// 也是选中样式
                        // borderWidth: 1,
                        areaColor: '#d7b25f',
                        label: {
                            show: 'scale',
                            textStyle: {
                                color: '#0063d2'
                            }
                        }
                    }
                },
                data: newChartsData,
                zlevel: 1,
                animation: true
            }]
        });
    });

//点击时的方法
    CountriesChart.on('click', function (params) {
        option.series[0].center = [currentData[i].longitude, currentData[i].latitude];
        option.series[0].layoutCenter = ['50%', '50%'];
        option.series[0].zoom = 7;
        CountriesChart.setOption(option);

    });
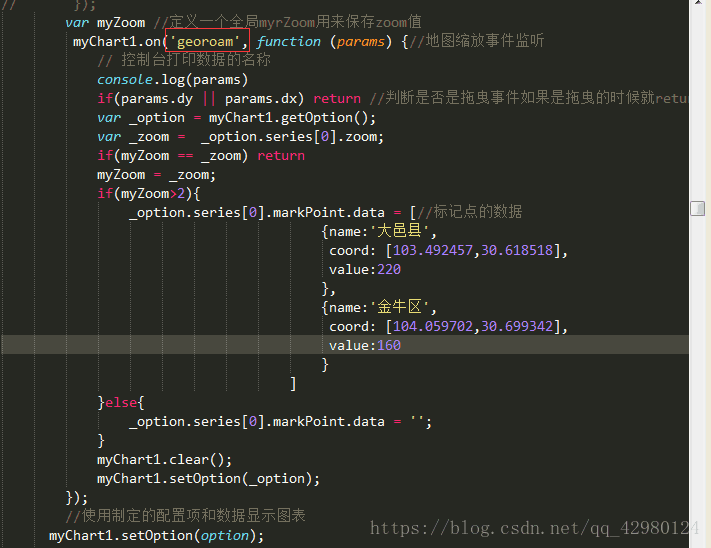
主要就是用到了echarts的georoam事件,官方文档没有看到这个事件,这个事件能监听缩放与拖曳事件
setTimeout(() => { // setOption前隐藏loading事件 mycharts.hideLoading(); mycharts.setOption(option); }, 1000);
大佬,解决了吗
主要是版本太高了,你试试echarts的4.1.0版本,亲测是可以的,但是我用5.2.1版本不行,不知道为啥
注意这个函数zoomAnimation,现在好像要自己加动画了这个问题解决了么?
我也想问,在切换echarts的时候怎么加入弹出的切动画效果
感觉我这种咵咵切换很生硬
过渡动画类似于 官网上双击的效果即可
https://echarts.apache.org/v4/examples/zh/editor.html?c=effectScatter-bmap