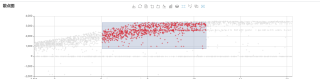
pyecharts 大数据量散点图 工具箱配置矩形选择错误 python
使用pyecharts画散点图,数据量超过3k,工具箱配置矩形选择就不正确,求大神!!!!!!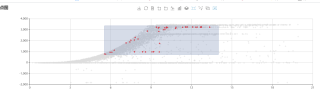
放大后就行
from pyecharts import options as opts
from pyecharts.charts import Scatter
from pyecharts.faker import Faker


scatter = Scatter(init_opts=opts.InitOpts(width='1500px', height='400px'))
scatter.add_xaxis(x)
scatter.add_yaxis(
    series_name="test",
    y_axis=y,
    symbol_size=6,
    symbol="path://M1041.066667 648.533333l-375.466667 0 0 375.466667-273.066667 0L392.533333 648.533333l-375.466667 0 0-273.066667 375.466667 0L392.533333 0l273.066667 0 0 375.466667 375.466667 0L1041.066667 648.533333z",
    color="red",
    label_opts=opts.LabelOpts(is_show=False)
)
scatter.set_global_opts(
    title_opts=opts.TitleOpts(title="散点图"),
    xaxis_opts=opts.AxisOpts(
                            type_="value",    # 设置X轴为数值轴
                            splitline_opts=opts.SplitLineOpts(is_show=True),  # X轴分割线
                            axisline_opts=opts.AxisLineOpts(
                                                is_on_zero=False,
                                                linestyle_opts=opts.LineStyleOpts()
                                            ),
    ),
    yaxis_opts=opts.AxisOpts(
                            splitline_opts=opts.SplitLineOpts(is_show=True),  # Y轴分割线
                            axisline_opts=opts.AxisLineOpts(
                                                is_on_zero=False,
                                                linestyle_opts=opts.LineStyleOpts()
                                            )
     ),
    legend_opts=opts.LegendOpts(is_show=False),
    toolbox_opts=opts.ToolboxOpts(is_show=True,
                                  feature=opts.ToolBoxFeatureOpts(
                                                    magic_type=opts.ToolBoxFeatureMagicTypeOpts(is_show=False),
                                                    brush=opts.ToolBoxFeatureBrushOpts()),
                                  pos_left='40%'),
    datazoom_opts=opts.DataZoomOpts(range_start=0, range_end=100, type_="inside", is_show=False),
    # brush_opts=opts.BrushOpts(),
    # brush_opts=opts.BrushOpts(tool_box=["rect", "polygon", "keep", "clear"],),
),

scatter.set_series_opts(
    # label_opts=opts.LabelOpts(is_show=False),

)
scatter.render("scatter_base.html")