求前端大神提供模板 想要做如下的圆环百分比!或者提供链接也行鸭。谢谢了
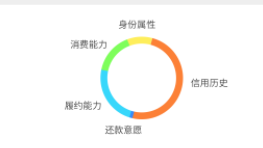
想实现图片上的功能 求提供模板
图表我现在用echarts做的,官网都有例子,文档也简单,你可以看看
http://echarts.baidu.com/examples/#chart-type-pie
easy-pie-chart 可以了解一下
https://github.com/rendro/easy-pie-chart
http://www.hana.co/archives/286
 <div id="percent_" class="easy-pie-chart percentage easyPieChart" data-percent="0" data-color="#87B87F" style="width: 45px; height: 45px; line-height: 45px; color: rgb(135, 184, 127);">
                                <span class="percent">0</span>%
                                <canvas width="45" height="45"></canvas>
                            </div>
 //初始化
$("#percent_").easyPieChart({
                barColor: '#87B87F',
                trackColor: '#EEEEEE',
                scaleColor: false,
                lineCap: 'butt',
                lineWidth: 5,
                size:45
            }).css('color', $("#percent_").data('color'));

    //更新
 $('#percent_').data('easyPieChart').update(aaa.toFixed(0));
有点断章取义,还是要靠自己去了解
echarts 可能更方便。上面那个只能做百分比的样子……
 <div id="chart_main" style="width: 400px;height:400px;"></div>
                                 <script type="text/javascript">

        // 使用刚指定的配置项和数据显示图表。
       $(function(){
           // 基于准备好的dom,初始化echarts实例
            var myChart = echarts.init(document.getElementById('chart_main'));
            //数据来源
            var _data =[];
            $('.accout_category').find('li').each(function(){
                var map = {};
                map.name = $(this).attr("data-name");
                map.value = $(this).attr("data-amount");
                _data.push(map);
            })

                // 指定图表的配置项和数据
            var chartoption = {
            title : {
                text: '您的账户总览',
                //subtext: '总创收¥150',
                x:'center'
            },
            tooltip : {
                trigger: 'item',
              formatter: "{a} <br/>{b} : {c} ({d}%)"
            },

            series : [
                {
                    name: '账户总揽',
                    type: 'pie',
                    radius : '60%',
                    center: ['50%', '50%'],
                    data:_data,
                    itemStyle: {
                        emphasis: {
                            shadowBlur: 10,
                            shadowOffsetX: 0,
                            shadowColor: 'rgba(0, 0, 0, 0.5)'
                        }
                    }
                }
            ]
        }
           myChart.setOption(chartoption);

       })
    </script>
我只是大自然的搬运工