var yearCount = result.legend.length;
var categoryCount = result.category.length;
                                var xAxisData = result.category;
                                var customData = [];
                                var legendData = [];
                                var dataList = [];

                                legendData.push('trend');
                                var encodeY = [];
                                for (var i = 0; i < yearCount; i++) {
                                    legendData.push(result.legend[i]);
                                    dataList.push([]);
// customData.push(result.series[i].listData);
encodeY.push(1 + i);
}
for (var i = 0; i < categoryCount; i++) {
// xAxisData.push('category' + i);
var customVal = [i];
customData.push(customVal);
// var data = dataList[0];
for (var j = 0; j < dataList.length; j++) {
dataList[j].push(result.series[i].listData[j]);
customVal.push(result.series[i].listData[j]);
}
}
                                function renderItem(params, api) {
                                    var xValue = api.value(0);
                                    var currentSeriesIndices = api.currentSeriesIndices();
                                    var barLayout = api.barLayout({
                                        barGap: '30%', barCategoryGap: '20%', count: currentSeriesIndices.length - 1
                                    });

                                    var points = [];
                                    for (var i = 0; i < currentSeriesIndices.length; i++) {
                                        var seriesIndex = currentSeriesIndices[i];
                                        if (seriesIndex !== params.seriesIndex) {
                                            var point = api.coord([xValue, api.value(seriesIndex)]);
                                            point[0] += barLayout[i - 1].offsetCenter;
                                            point[1] -= 20;
                                            points.push(point);
                                        }
                                    }
                                    var style = api.style({
                                        stroke: api.visual('color'),
                                        fill: null
                                    });

                                    return {
                                        type: 'polyline',
                                        shape: {
                                            points: points
                                        },
                                        style: style
                                    };
                                }

                                option = {
                                    tooltip: {
                                        trigger: 'axis'
                                    },
                                    legend: {
                                        data: legendData
                                    },
// dataZoom: [{
// type: 'slider',
// start: 50,
// end: 70
// }, {
// type: 'inside',
// start: 50,
// end: 70
// }],
xAxis: {
data: xAxisData
},
yAxis: {},
series: [{
type: 'custom',
name: 'trend',
renderItem: renderItem,
itemStyle: {
normal: {
borderWidth: 2
}
},
encode: {
x: 0,
y: encodeY
},
data: customData,
z: 100
}].concat(echarts.util.map(dataList, function (data, index) {
console.log(data);
console.log("legendData[index + 1] "+legendData[index + 1]);
return {
type: 'bar',
animation: false,
name: legendData[index + 1],
itemStyle: {
normal: {
opacity: 0.5
}
},
data: data
};
}))
};
console.log打印出来 数据顺序对着 ,谁知道为什么乱了 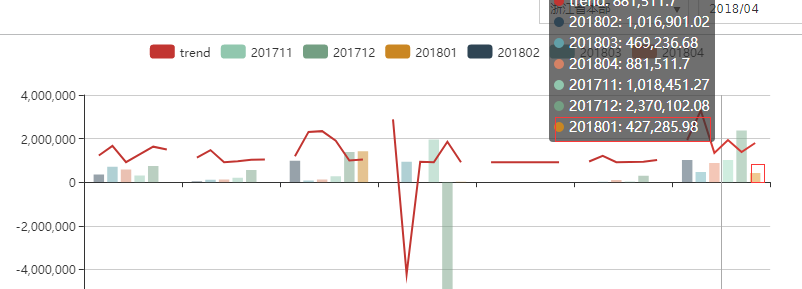
截图吧,估计你这是因为文字标题过长,就是每个柱状对应的文字过长,导致图标错位,解决办法,文字变短,或者加宽图表