python 关于调整子图间距
我用python中的matplotlib作图,但子图上下间距太近,遮挡了横坐标,请问一下要怎么处理才能将上下间距调大,能显示出所有子图的横坐标。
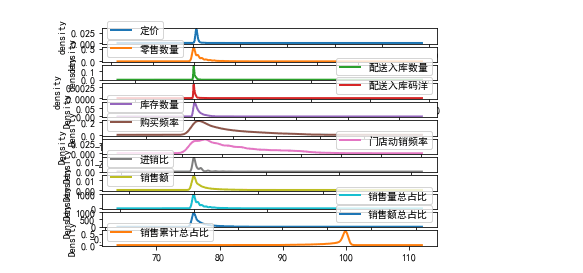
下面是我作图的代码:
def density_plot(data): #自定义作图函数
plt.rcParams['font.sans-serif']=['SimHei']
plt.rcParams['axes.unicode_minus']=False
p = data.plot(kind='kde', linewidth = 2, subplots = True, sharex = False)
[p[i].set_ylabel('density') for i in range(k)]
plt.legend()
return plt
density_plot(df_x[r0[u'聚类类别']==0])
使用subplots_adjust来调整子图的间距
plt.subplots_adjust(left=None, bottom=None, right=None, top=None,
                wspace=None, hspace=None)
其中的wspace是子图之间的垂直间距,hspace是子图的上下间距,调整这两个值就可以,多试试取值。