如何使用python绘制以下折线图
编程小白求指教
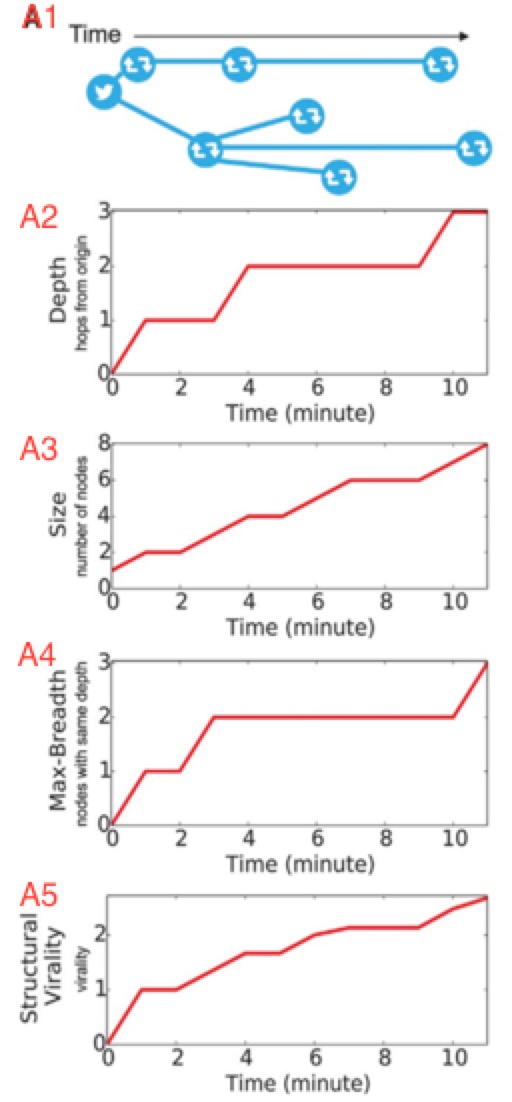
根据图一所示结构,统计随时间增长的深度、宽度、节点数,并绘制折线图
可以参考下 https://www.jianshu.com/p/5bccad7a62dc
可以参考官方教程 https://matplotlib.org/users/pyplot_tutorial.html
官网文档地址:
https://matplotlib.org/users/pyplot_tutorial.html
简书地址:
https://www.jianshu.com/p/5bccad7a62dc