关于matlab的legend函数标识问题
各位大神,在下有一个问题。在matlab中使用plot函数画图和legend函数标识时,legend函数的标识会出问题。
具体代码如下:
figure(1);
plot(trainsample1(:),1,'ob');
hold on;
plot(trainsample2(:),1,'og');
hold on;
plot(testsample1(:),1,'+r');
hold on;
plot(testsample2(:),1,'+k');
hold on;
legend('train1','train2','test1','test2');
但是结果出现的是图片那样,所有标识都是蓝圈。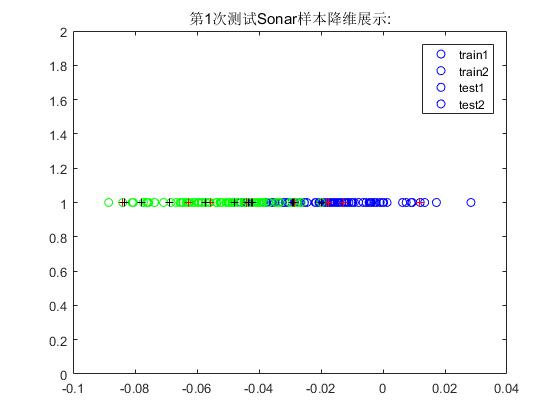
https://zhidao.baidu.com/question/263160521147603725.html
http://jingyan.baidu.com/article/6b182309a134b5ba58e15911.html
试试这个,我之前也出现过类似的问题