萌新请问echarts饼图中间的总数统计显示出来是需要调用函数吗?
萌新求教如图这个中间的总数
就是那种改了饼图三个数据,中间的总数也会变化的,函数调用不是很会写诶。可以请大佬指点一下吗
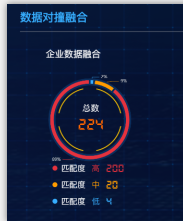
下方legend里的匹配度是手打的。高 200 和中 20 颜色和图上一样也是要绑定的吗?
还有一个可以请教一下怎么单独把数字设置成这种样式哒?
目前进程只到了这个样子。
新生入vue不就还有好多东西要学习,js有很多语法也还是一知半解。
会努力学习的!!就劳各位大佬出手帮助一下,感激不尽!!
中间显示使用graphic选项,样式自己调
graphic: {
                            elements: [{
                                type: 'text',
                                left: 'center',
                                top: '45%',
                                style: {
                                    text: "总数",
                                    textAlign: 'center',
                                    fill: '#000',
                                    width: 30,
                                    height: 30,
                                    fontSize: 12,
                                                                        color:'#ffffff'
                                }
                            }, {
                                type: 'text',
                                left: 'center',
                                top: '60%',
                                style: {
                                    text: '224', //这里改用实际值
                                    textAlign: 'center',
                                    fill: 'darkgray',
                                    width: 30,
                                    height: 25,
                                    fontSize: 14,
                                                                        color:'red'
                                }
                            }]
                        }
下面的legend,大概这样
legend: {
                            show: true,
                            orient: 'vertical',
                            x:'center',
                            y: 'middle',
                            borderWidth: 0,
                            data: legendArray, //使用实际数据
                            itemGap: 6,//图例之间间隔,
                            itemWidth: 14,
                            itemHeight:10,
                            fontSize:11
                        }
多看下api: https://echarts.apache.org/zh/option.html#legend
title: {
text: '总数,
subtext: '224',
x: 'center',
y: 'center'
}