matlab中使用fftshift后图像原点并没有移动到fs/2处?
图一是fftshift前的图像 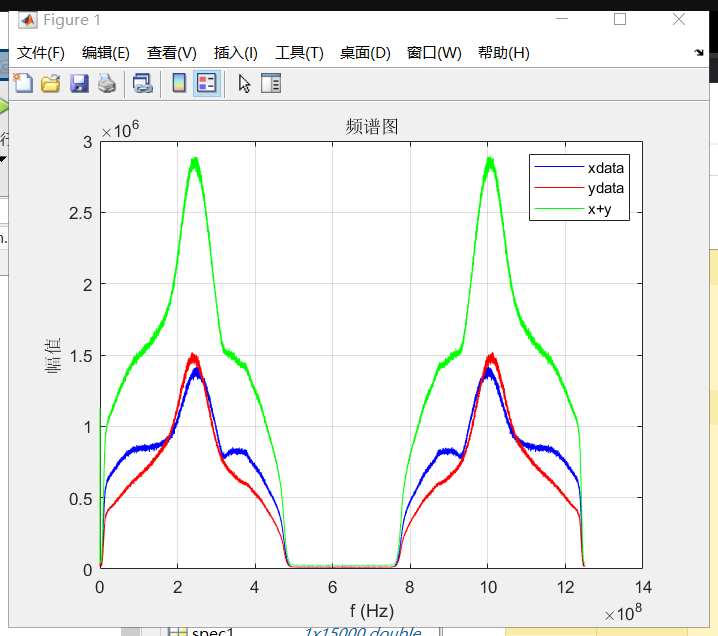
图二是fftshift后的图像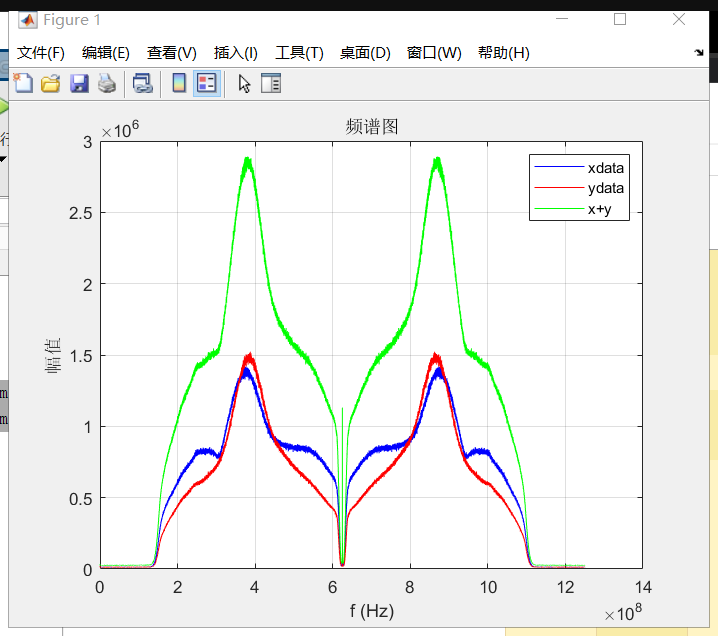
代码如下
fs=1250000000;dt=1/fs;N=15000;
dLength=N;
pulseNum=2048;
f=(0:N-1)*fs/N;
spec1 = sum(abs(fft(xdata,[],2)))./pulseNum;
spec2 = sum(abs(fft(ydata,[],2)))./pulseNum;
spec1=fftshift(spec1);
spec2=fftshift(spec2);
plot(f,spec1,'b');hold on;
plot(f,spec2,'r');hold on;
plot(f,spec2+spec1,'g')
grid on
legend('xdata','ydata','x+y')
title("频谱图");
xlabel("f (Hz)")
ylabel("幅值")
https://blog.csdn.net/cswh876908060/article/details/54174206/