vue中使用echarts,数据更新后无法重新绘制图表?
 getTransformerSubstation3 () {
        // this.myChart3.clear()
        this.myChart3 = this.$echarts.init(document.getElementById('oneChart3'))
        api
          .getTransformerSubstation3(this.bdzparams)
          .then(data => {

            this.transformerSubstationList3 = data
            let option = {
              yAxis: {
                type: 'category',
                data: this.transformerSubstationList3.data.Asix,
              },
              xAxis: {
                type: 'value',
              },
              series: [
                {
                  data: this.transformerSubstationList3.data.data0,
                  type: 'bar',
                  itemStyle: {
                    normal: {
                      color: '#32b16c',
                      label: {
                        show: true,
                        position: 'right',
                        textStyle: {
                          color: 'black',
                          fontSize: 10,
                        },
                      },
                    },
                  },
                  barWidth: 20,
                },
              ],
              grid: {
                x: '3%',
                y: '20%',
                bottom: '3%',
                containLabel: true,
              },

                },
              },
            }
            this.myChart3.setOption(option)
          })
      },
引用 皆我百晓生 小程序回复内容作答:
在Vue中使用echarts时,如果想要更新数据后重新绘制图表,可以先调用clear方法清空已有图表,并重新初始化myChart3。
下面是修改后的代码:
getTransformerSubstation3() {
  if (this.myChart3) {
    this.myChart3.clear();
  }
  this.myChart3 = this.$echarts.init(document.getElementById('oneChart3'));
  api.getTransformerSubstation3(this.bdzparams).then((data) => {
    this.transformerSubstationList3 = data;
    let option = {
      yAxis: {
        type: 'category',
        data: this.transformerSubstationList3.data.Asix,
      },
      xAxis: {
        type: 'value',
      },
      series: [
        {
          data: this.transformerSubstationList3.data.data0,
          type: 'bar',
          itemStyle: {
            normal: {
              color: '#32b16c',
              label: {
                show: true,
                position: 'right',
                textStyle: {
                  color: 'black',
                  fontSize: 10,
                },
              },
            },
          },
          barWidth: 20,
        },
      ],
      grid: {
        x: '3%',
        y: '20%',
        bottom: '3%',
        containLabel: true,
      },
    };
    this.myChart3.setOption(option);
  });
},
在每次更新数据之前,先判断myChart3是否存在,如果存在则调用clear方法清空已有图表。然后重新初始化myChart3并设置新的数据和配置项,最后调用setOption方法重新绘制图表。这样就可以实现数据更新后重新绘制图表了。
【相关推荐】
- 帮你找了个相似的问题, 你可以看下: https://ask.csdn.net/questions/7494926
- 这篇博客你也可以参考下:在vue中使用echarts,亲自操作配置步骤
- 您还可以看一下 jason老师的vue通用后台管理课程中的 echarts表格的基本使用小节, 巩固相关知识点
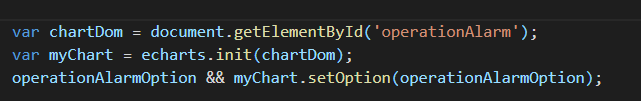
- 除此之外, 这篇博客: vue中如何使用echarts——以折线图为例中的 获取容器 部分也许能够解决你的问题, 你可以仔细阅读以下内容或跳转源博客中阅读:
如果你已经解决了该问题, 非常希望你能够分享一下解决方案, 写成博客, 将相关链接放在评论区, 以帮助更多的人 ^-^
一般重新setOption就可以了,如果不更新的话,可以尝试设置notMerge: true


Documentation - Apache ECharts Apache ECharts,一款基于JavaScript的数据可视化图表库,提供直观,生动,可交互,可个性化定制的数据可视化图表。  https://echarts.apache.org/zh/api.html#echartsInstance.setOption
https://echarts.apache.org/zh/api.html#echartsInstance.setOption