excel中折线图导出
在处理excel文件的时候遇到一个问题,使用openpyxl在excel中插入一个折线图后,这个折线图该如何导出图片?我尝试过用压缩的方法,但是发现本身的折线图并不是图片格式,也没有找到更好的方法,请教一下各位
linechart1=LineChart()
linechart1.title='参数小时值变化趋势图'#添加表格标题

linechart1.style=13 #表格样式
linechart1.y_axis.title='浓度值ug/m3'
linechart1.x_axis.title='时间'
linechart1.height = 12#表格高度
linechart1.width =20#表格宽度

#设置表格添加位置
data_ws2.add_chart(linechart1,"A20")
#选择数据范围
ws2_max_row=data_ws2.max_row
b=10
if ws2_max_row<b:
    ws2_max_row=b
x_values=Reference(data_ws2,min_col=11,min_row=2,max_row=ws2_max_row)#给x坐标赋值
data_linechart1=Reference(data_ws2,min_col=5,min_row=1,max_col=7,max_row=ws2_max_row)
linechart1.add_data(data_linechart1,titles_from_data=True)
linechart1.set_categories(x_values)
data_jsp.save('./data/{}.xlsx'.format(dt.strftime ("%Y-%m-%d")))#保存data文件
- 你可以看下这个问题的回答https://ask.csdn.net/questions/7475419
- 这篇博客也不错, 你可以看下对比Excel学openpyxl系列之设置excel对齐方式
- 除此之外, 这篇博客: 对比Excel学openpyxl系列之设置excel数字和条件格式中的 数字格式 部分也许能够解决你的问题, 你可以仔细阅读以下内容或跳转源博客中阅读:
要 对 数 字 的 显 示 格 式 进 行 调 整 , 需 要 用 到number_format属性,具体形式如下:
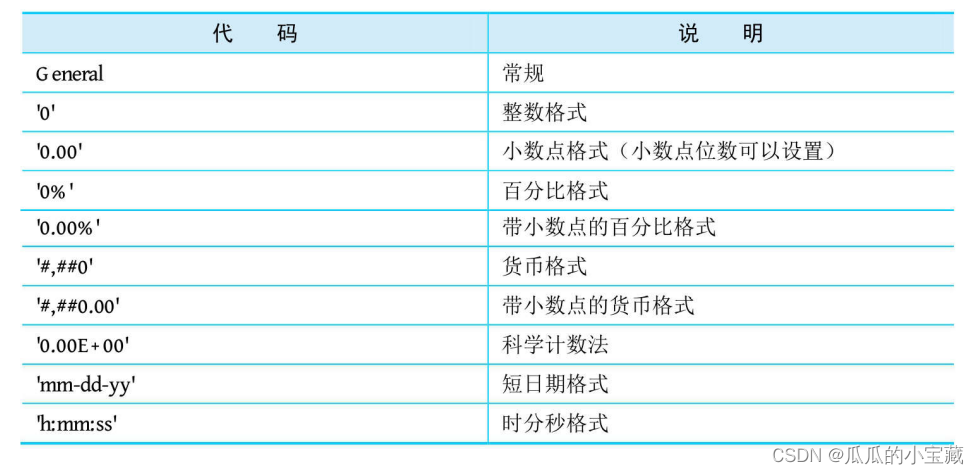
from openpyxl import Workbook
import datetime
wb=Workbook()
ws=wb.active
ws['A2']=1
ws['A2'].number_format='General'#常规格式

ws['A3']=1
ws['A3'].number_format='0.00'#保留两位小数


ws['A3']=1
ws['A3'].number_format='0.0%'#设置成百分比格式

ws['A4']=100000
ws['A4'].number_format='#,##0'#设置千分位格式

ws['A5']=100000
ws['A5'].number_format='0.00E+00'#科学计数法

ws['A6']=datetime.datetime(2018,3,20,10,20,39)
ws['A6'].number_format='mm-dd-yy'#日期格式


ws['A7']=datetime.datetime(2018,3,20,10,20,39)
ws['A7'].number_format='h:mm:ss'#时间格式
wb.save(r'C:\Users\mac\Desktop\test10.xlsx')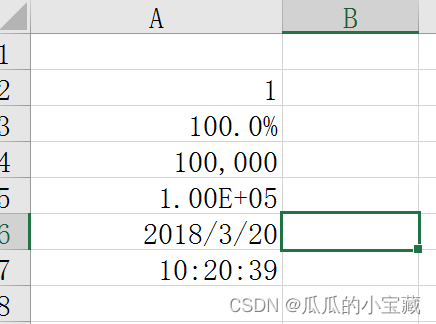
- 您还可以看一下 曾贤志老师的【曾贤志】openpyxl处理Excel数据 - 第2季 巩固篇课程中的 1.18 实例应用(单工作簿拆分到多工作簿中(单表中))小节, 巩固相关知识点
- 以下回答由chatgpt基于相关博客总结生成:
可以使用Pillow(Python Imaging Library,PIL)来将Excel文件中的折线图导出为图片。具体步骤如下:
1.使用openpyxl打开Excel文件并读取折线图
from openpyxl import load_workbook

wb = load_workbook('test.xlsx')
ws = wb.active
chart = ws['A1'].chart
这里假设折线图位于A1格中,如果不确定图表的位置,可以通过
ws._charts属性查看当前工作表中所有的图表。2.将读取到的折线图转为文本
chart_string = chart.to_tree()3.使用Pillow将文本转为图片
from PIL import Image, ImageDraw, ImageFont
from io import BytesIO

img = Image.new('RGBA', chart.width, chart.height, (255, 255, 255, 0))
draw = ImageDraw.Draw(img)
txt = BytesIO(chart_string.tostring())
font = ImageFont.load_default()

while True:
    s = txt.readline()
    if not s:
        break
    y = int(s[s.index(b"y='") + 3:s.index(b'"/>')])
    if y < 0:
        continue
    elif y == 0:
        s = s.replace(b'width=', b'xxx=')
    x = int(s[s.index(b"x='") + 3:s.index(b'" y=')])
    draw.text((x, y), s.decode(), fill=(0, 0, 0), font=font)

img.save('test.png')
这里将读取到的折线图转为文本,然后根据文本中的坐标信息逐条绘制在一个新建的Pillow图片中。最后将图片保存到本地即可。
参考资料: - openpyxl的chart类 - 使用Pillow将SVG转为图片