python做聚类分析找K值的时候报错可能的原因和解决方法
#这里运行没问题
import pandas as pd
import re
import jieba

df = pd.read_csv('1-6/汇总内容3.csv')
df.sample(10)

stoptext = open('data/stopwords.txt', encoding='utf-8').read()
stopwords = stoptext.split('\n')

def clean_text(text):
    words = jieba.lcut(text)
    words = [w for w in words if w not in stopwords]
    return ' '.join(words)


test = open('1-6/汇总内容3.csv', encoding='utf-8').read()
clean_text(test)

df['content'] = df['text'].apply(clean_text)
df.head()

from sklearn.feature_extraction.text import CountVectorizer, TfidfVectorizer

vectorizer = TfidfVectorizer()
doc_term_matrix = vectorizer.fit_transform(df['content'])
doc_term_matrix

%matplotlib inline
import numpy as np
import matplotlib.pyplot as plt
from sklearn.cluster import KMeans


def find_the_best_K(X, min_k, max_k):

    ks = list(range(min_k, max_k+1))
    scores = []
    for k in ks:
        estimator = KMeans(n_clusters=k, random_state=100)
        estimator.fit(X)
        score = - estimator.score(X)
        scores.append(score)
    plt.figure(figsize=(8, 5))
    plt.plot(ks, scores, label='search the best K with Elbow method', color='red', linewidth=1)
    plt.xlabel('k')
    plt.ylabel('distortions')
    plt.show()
#这一步显示错误
find_the_best_K(X = doc_term_matrix,
min_k=2,
max_k=20)
AttributeError                            Traceback (most recent call last)
~\AppData\Local\Temp\ipykernel_12172\4020348237.py in
      1 #运行比较慢
----> 2 find_the_best_K(X = doc_term_matrix,
      3                 min_k=2,
      4                 max_k=20)

~\AppData\Local\Temp\ipykernel_12172\3692014792.py in find_the_best_K(X, min_k, max_k)
     20         estimator = KMeans(n_clusters=k, random_state=100)
     21         estimator.fit(X)
---> 22         score = - estimator.score(X)
     23         scores.append(score)
     24     #设置图的大小

C:\ProgramData\Anaconda3\lib\site-packages\sklearn\cluster\_kmeans.py in score(self, X, y, sample_weight)
   1362         sample_weight = _check_sample_weight(sample_weight, X, dtype=X.dtype)
   1363
-> 1364         return -_labels_inertia_threadpool_limit(
   1365             X, sample_weight, x_squared_norms, self.cluster_centers_, self._n_threads
   1366         )[1]

C:\ProgramData\Anaconda3\lib\site-packages\sklearn\cluster\_kmeans.py in _labels_inertia_threadpool_limit(X, sample_weight, x_squared_norms, centers, n_threads)
    753 ):
    754     """Same as _labels_inertia but in a threadpool_limits context."""
--> 755     with threadpool_limits(limits=1, user_api="blas"):
    756         labels, inertia = _labels_inertia(
    757             X, sample_weight, x_squared_norms, centers, n_threads

C:\ProgramData\Anaconda3\lib\site-packages\sklearn\utils\fixes.py in threadpool_limits(limits, user_api)
    312         return controller.limit(limits=limits, user_api=user_api)
    313     else:
--> 314         return threadpoolctl.threadpool_limits(limits=limits, user_api=user_api)
    315
    316

C:\ProgramData\Anaconda3\lib\site-packages\threadpoolctl.py in __init__(self, limits, user_api)
    169             self._check_params(limits, user_api)
    170
--> 171         self._original_info = self._set_threadpool_limits()
    172
    173     def __enter__(self):

C:\ProgramData\Anaconda3\lib\site-packages\threadpoolctl.py in _set_threadpool_limits(self)
    266             return None
    267
--> 268         modules = _ThreadpoolInfo(prefixes=self._prefixes,
    269                                   user_api=self._user_api)
    270         for module in modules:

C:\ProgramData\Anaconda3\lib\site-packages\threadpoolctl.py in __init__(self, user_api, prefixes, modules)
    338
    339             self.modules = []
--> 340             self._load_modules()
    341             self._warn_if_incompatible_openmp()
    342         else:

C:\ProgramData\Anaconda3\lib\site-packages\threadpoolctl.py in _load_modules(self)
    371             self._find_modules_with_dyld()
    372         elif sys.platform == "win32":
--> 373             self._find_modules_with_enum_process_module_ex()
    374         else:
    375             self._find_modules_with_dl_iterate_phdr()

C:\ProgramData\Anaconda3\lib\site-packages\threadpoolctl.py in _find_modules_with_enum_process_module_ex(self)
    483
    484                 # Store the module if it is supported and selected
--> 485                 self._make_module_from_path(filepath)
    486         finally:
    487             kernel_32.CloseHandle(h_process)

C:\ProgramData\Anaconda3\lib\site-packages\threadpoolctl.py in _make_module_from_path(self, filepath)
    513             if prefix in self.prefixes or user_api in self.user_api:
    514                 module_class = globals()[module_class]
--> 515                 module = module_class(filepath, prefix, user_api, internal_api)
    516                 self.modules.append(module)
    517

C:\ProgramData\Anaconda3\lib\site-packages\threadpoolctl.py in __init__(self, filepath, prefix, user_api, internal_api)
    604         self.internal_api = internal_api
    605         self._dynlib = ctypes.CDLL(filepath, mode=_RTLD_NOLOAD)
--> 606         self.version = self.get_version()
    607         self.num_threads = self.get_num_threads()
    608         self._get_extra_info()

C:\ProgramData\Anaconda3\lib\site-packages\threadpoolctl.py in get_version(self)
    644                              lambda: None)
    645         get_config.restype = ctypes.c_char_p
--> 646         config = get_config().split()
    647         if config[0] == b"OpenBLAS":
    648             return config[1].decode("utf-8")

AttributeError: 'NoneType' object has no attribute 'split'
参考GPT和自己的思路:
根据错误提示信息,是在执行threadpoolctl.py的get_version函数时出错,说没有split方法,因为返回值是NoneType。可能原因是缺少了需要的库或环境变量没有正确设置。
可以尝试升级或重新安装threadpool库,或者检查是否缺少了某些依赖库。同时也可以尝试在环境变量中添加OPENBLAS_NUM_THREADS=1,或者使用export OPENBLAS_NUM_THREADS=1命令设置该变量。
- 这个问题的回答你可以参考下: https://ask.csdn.net/questions/361578
- 你也可以参考下这篇文章:Python报错
- 除此之外, 这篇博客: Python机器学习14——聚类分析中的 K均值聚类的Python案例 部分也许能够解决你的问题, 你可以仔细阅读以下内容或者直接跳转源博客中阅读:
使用模拟数据进行聚类,模拟数据的好处在于我们知道真实的样本的类别
#K-Means Clustering
import numpy as np
import pandas as pd
import matplotlib.pyplot as plt
import seaborn as sns

from sklearn.cluster import KMeans
from sklearn.cluster import AgglomerativeClustering
from sklearn.preprocessing import StandardScaler
from mpl_toolkits.mplot3d import Axes3D
from scipy.cluster.hierarchy import linkage, dendrogram, fcluster
from scipy.spatial.distance import squareform
生成两组数据,可视化
np.random.seed(1)
cluster1 = np.random.normal(0, 1, 100).reshape(-1, 2)
cluster1 = pd.DataFrame(cluster1, columns=['x1', 'x2'])
cluster1['y'] = 0
cluster1.head()

np.random.seed(10)
cluster2 = np.random.normal(3, 1, 100).reshape(-1, 2)
cluster2 = pd.DataFrame(cluster2, columns=['x1', 'x2'])
cluster2['y'] = 1
cluster2.head()

data = pd.concat([cluster1, cluster2])
data.shape

sns.scatterplot(x='x1', y='x2', data=cluster1, color='k', label='y=0')
sns.scatterplot(x='x1', y='x2', data=cluster2, color='b', label='y=1')
plt.legend()
plt.title('True Clusters (K=2)')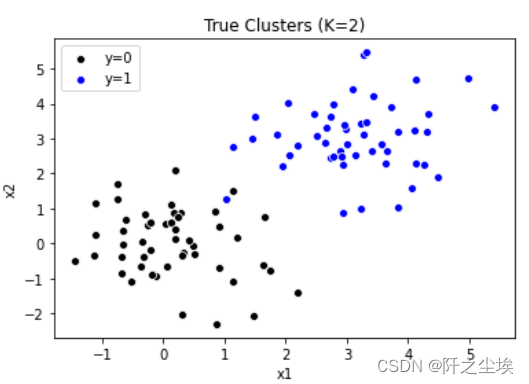
取出X和y,进行K均值聚类
X = data.iloc[:, :-1]
y = data.iloc[:, -1]

model = KMeans(n_clusters=2, random_state=123, n_init=20)
model.fit(X)
#查看聚类标签
model.labels_
#查看聚类中心
model.cluster_centers_
#查看组内平方和
model.inertia_
#画混淆矩阵
pd.crosstab(y, model.labels_, rownames=['Actual'], colnames=['Predicted'])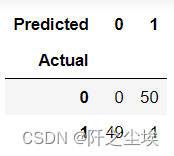
结果可视化
sns.scatterplot(x='x1', y='x2', data=data[model.labels_ == 0], color='k', label='y=0')
sns.scatterplot(x='x1', y='x2', data=data[model.labels_ == 1], color='b', label='y=1')
plt.legend()
plt.title('Estimated Clusters (K=2)')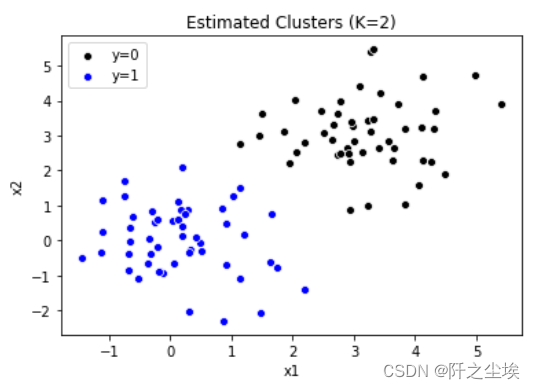
将数据聚为三类
model = KMeans(n_clusters=3, random_state=2, n_init=20)
model.fit(X)

model.labels_
sns.scatterplot(x='x1', y='x2', data=data[model.labels_ == 0], color='k', label='y=0')
sns.scatterplot(x='x1', y='x2', data=data[model.labels_ == 1], color='b', label='y=1')
sns.scatterplot(x='x1', y='x2', data=data[model.labels_ == 2], color='cornflowerblue', label='y=2')
plt.legend()
plt.title('Estimated Clusters (K=3)')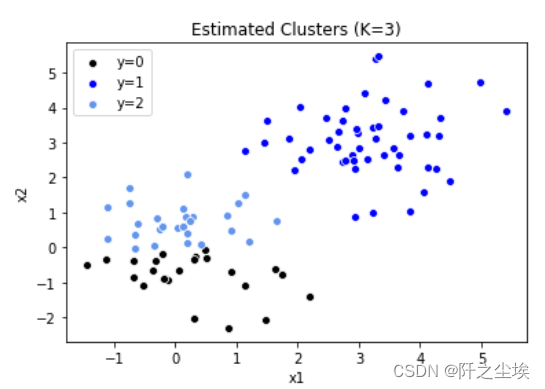
聚类的数目K如何取值,可以使用手肘法判断,即聚类个数K让误差快速下降的位置,则可以取K,误差为mse,手工循环,寻找最优聚类个数K
# Choose optimal K by elbow method
sse = []
for k in range(1,16):
    model = KMeans(n_clusters=k, random_state=1, n_init=20)
    model.fit(X)
    sse.append(model.inertia_)
print(sse)

#画图
plt.plot(range(1, 16), sse, 'o-')
plt.axhline(sse[1], color='k', linestyle='--', linewidth=1)
plt.xlabel('K')
plt.ylabel('SSE')
plt.title('K-means Clustering')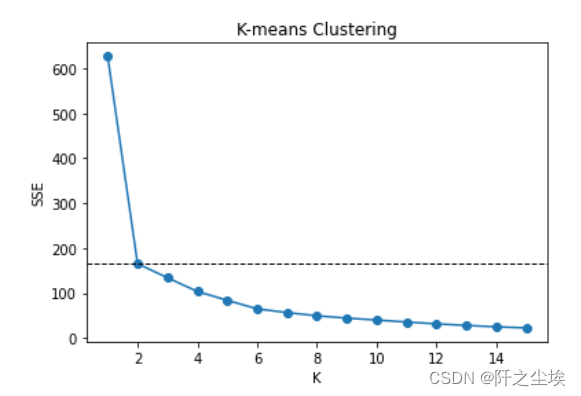
K从1到2下降速度最快,后面没有明显的拐点,k选2最佳
还可以利用AIC个BIC信息准则去挑选(传统统计学方法,如今用得少,效果也不太行)
#AIC
# Choose optimal K by AIC
aic = sse + 2 * 2 * np.arange(1, 16)
aic
min(aic)
np.argmin(aic)
plt.plot(range(1, 16), aic, 'o-')
plt.axvline(np.argmin(aic) + 1, color='k', linestyle='--', linewidth=1)
plt.xlabel('K')
plt.ylabel('AIC')
plt.title('K-means Clustering')

#BIC
# Choose optimal K by BIC
bic = sse + 2 * np.log(100) * np.arange(1, 16)
bic
min(bic)
np.argmin(bic)
plt.plot(range(1, 16), bic, 'o-')
plt.axvline(np.argmin(bic) + 1, color='k', linestyle='--', linewidth=1)
plt.xlabel('K')
plt.ylabel('BIC')
plt.title('K-means Clustering')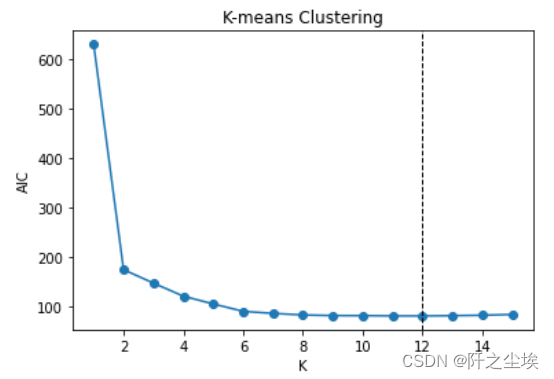
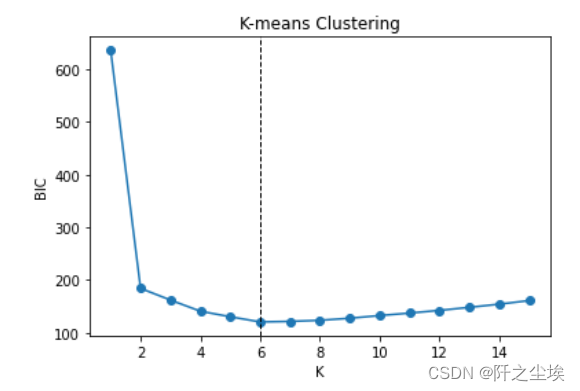
AIC说选12个,BIC说选6个,和真实的2个差的有点远...
下面采用鸢尾花数据集三个特征变量进行聚类,可以在三维空间图里面可视化
iris = pd.read_csv('iris.csv')
Dict = {'setosa': 0, 'versicolor': 1, 'virginica': 2}
iris.species = iris.species.map(Dict)

fig = plt.figure()
ax = fig.add_subplot(111, projection='3d')
ax.scatter(iris['sepal_length'], iris['sepal_width'],
           iris['petal_length'], c=iris['species'], cmap='rainbow')
ax.set_xlabel('sepal_length')
ax.set_ylabel('sepal_width')
ax.set_zlabel('petal_length')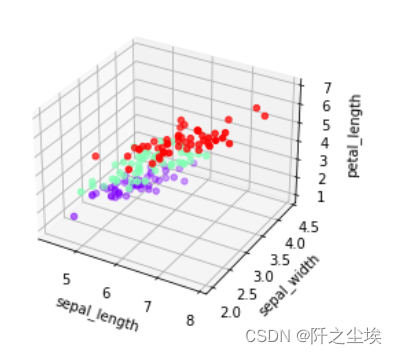
聚类
# K-means clustering with K=3 X3= iris.iloc[:, :3] model = KMeans(n_clusters=3, random_state=1, n_init=20) model.fit(X3) model.labels_ labels = pd.DataFrame(model.labels_, columns=['label']) d = {0: 0, 1: 2,2:1} pred = labels.label.map(d) table = pd.crosstab(iris.species, pred, rownames=['Actual'], colnames=['Predicted']) table accuracy = np.trace(table) / len(iris) accuracy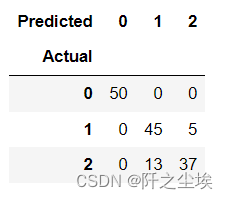 误差不多,聚类结果不错
fig = plt.figure()
ax = fig.add_subplot(111, projection='3d')
ax.scatter(iris['sepal_length'], iris['sepal_width'],
           iris['petal_length'], c=pred, cmap='rainbow')
ax.set_xlabel('sepal_length')
ax.set_ylabel('sepal_width')
ax.set_zlabel('petal_length')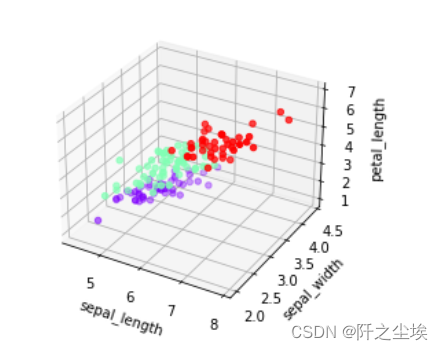
- 您还可以看一下 黄棒清老师的Python实战量化交易理财系统课程中的 双均线策略股票量化交易模拟实战小节, 巩固相关知识点
如果你已经解决了该问题, 非常希望你能够分享一下解决方案, 写成博客, 将相关链接放在评论区, 以帮助更多的人 ^-^