echarts排序问题
echarts排序问题
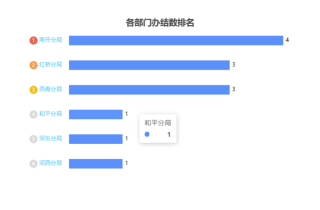
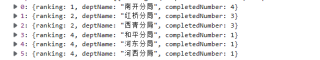
我怎么样才可以把这个12345排序数字替换成后台返回来的数据呢
      var chartDom = document.getElementById('deptFinish');
      var myChart = echarts.init(chartDom);
      var options;
      let ydata = JSON.parse(JSON.stringify(this.deptName));
      let xdata = this.completedRate;
      options = {
        title: {
          text: '各部门办结数排名',
          left: 'center',
          top:36
        },
        grid:{
          left:'0%',
          right:'12%',
          containLabel:true
        },
        tooltip: {
          trigger: "axis",
          axisPointer: {
            type: 'none'
          }
        },
        xAxis: {
          type: "value",
          show: false,
        },
        yAxis: {
          type: "category",
          offset: 3,
          data: ydata,
          axisLine: {
            show: false,
          },
          axisTick: {
            show: false,
          },
          axisLabel: {
            margin: 80,
            align: "left",
            overflow: "truncate",
            formatter: function (value, index) {
              let ind = index + 1;
              console.log(ydata.length - index)
              if (ind == ydata.length) {
                return "{one|" + (ydata.length - index) + "} {a|" + value + "}";
              } else if (ind + 1 == ydata.length) {
                return "{two|" + (ydata.length - index) + "} {b|" + value + "}";
              } else if (ind + 2 == ydata.length) {
                return (
                  "{three|" + (ydata.length - index) + "} {c|" + value + "}"
                );
              }
              if (ydata.length - index > 9) {
                return (
                  "{five|" + (ydata.length - index) + "} {d|" + value + "}"
                );
              }
              return "{four|" + (ydata.length - index) + "} {d|" + value + "}";
            },
            rich: {
              a: {
                color: "#59c9f9",
              },
              b: {
                color: "#59c9f9",
              },
              c: {
                color: "#59c9f9",
              },
              d: {
                color: "#59c9f9",
              },
              // 第一名
              one: {
                backgroundColor: "#E86452",
                color: "white",
                width: 12,
                height: 16,
                padding: [1, 0, 0, 5],
                borderRadius: 10,
                fontSize: 11,
              },
              // 第二名
              two: {
                backgroundColor: "#FF9845",
                color: "white",
                width: 12,
                height: 16,
                padding: [1, 0, 0, 5],
                borderRadius: 10,
                fontSize: 11,
              },
              // 第三名
              three: {
                backgroundColor: "#F6BD16",
                color: "white",
                width: 12,
                height: 16,
                padding: [1, 0, 0, 5],
                borderRadius: 10,
                fontSize: 11,
              },
              // 一位数
              four: {
                backgroundColor: "rgba(0,0,0,0.15)",
                color: "white",
                width: 12,
                height: 16,
                padding: [1, 0, 0, 5],
                borderRadius: 10,
                fontSize: 11,
              },
              // 两位数
              five: {
                backgroundColor: "rgba(0,0,0,0.15)",
                color: "white",
                width: 16,
                height: 16,
                padding: [1, 0, 0, 1],
                borderRadius: 10,
                fontSize: 11,
              },
            },
          },
        },
        series: [{
          type: "bar",
          showBackground: false,
          label: {
            show: true,
            // formatter:function(params){
            //   return params.value+'%'
            // },
            position: "right",
            color:'black',
          },
          barWidth: 20,
          itemStyle: {
            color: "#5B8FF9",
          },
          data: xdata,
        }, ],
      };
      options && myChart.setOption(options)
    },
什么意思,显示的label?
- 这有个类似的问题, 你可以参考下: https://ask.csdn.net/questions/7625832
- 这篇博客你也可以参考下:echarts遇到的问题解决方案
- 您还可以看一下 张丽丽老师的Echarts-0基础入门课程中的 Echarts 数据集 - 数据转换小节, 巩固相关知识点