学习matplotlib遇到的问题,cm模块没定义的东西还能用,为什么
matplotlib里面的写法千奇百怪啊
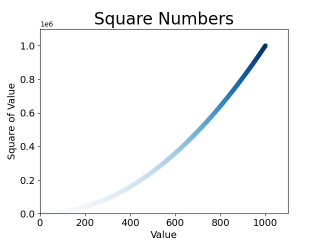
散点图scatter方法的渐变色
import matplotlib.pyplot as plt

x_values = list(range(1, 1001))
y_values = [x**2 for x in x_values]

# plt.cm.Blues 渐变为蓝色,y值越大颜色越深
plt.scatter(x_values, y_values, s=40, edgecolor='none', c=y_values, cmap=plt.cm.Blues)
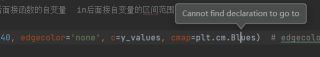
我想问的是,cm文件里没有Blues属性啊,但是却能用,这是什么原因
Blues找不到定义
……
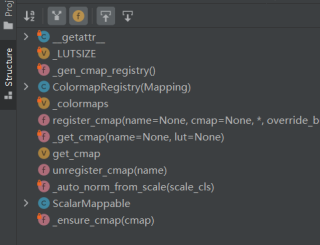
附上cm的结构
运行代码结果
……
散点图
……
Python编程是不是很难啊,我感觉有很多内容藏着掖着,什么原理都搞不清啊……
代码能运行,说明Blues这个属性肯定是存在的。但是它可以被动态添加(编辑器只能找到静态属性),比如下面的例子:
# 动态添加变量s,相当于 s = 'Hello world'
globals()['s'] = 'Hello world'

# 输出
print(s)
这里的print(s),编辑器也会报错说不存在变量,但实际上这段代码是可以运行的。
另外,回到问题,Blues属性的数据定义在隐藏的依赖_cm.py:
# 34 colormaps based on color specifications and designs
# developed by Cynthia Brewer (https://colorbrewer2.org/).
# The ColorBrewer palettes have been included under the terms
# of an Apache-stype license (for details, see the file
# LICENSE_COLORBREWER in the license directory of the matplotlib
# source distribution).

# RGB values taken from Brewer's Excel sheet, divided by 255

_Blues_data = (
    (0.96862745098039216,  0.98431372549019602,  1.0                ),
    (0.87058823529411766,  0.92156862745098034,  0.96862745098039216),
    (0.77647058823529413,  0.85882352941176465,  0.93725490196078431),
    (0.61960784313725492,  0.792156862745098  ,  0.88235294117647056),
    (0.41960784313725491,  0.68235294117647061,  0.83921568627450982),
    (0.25882352941176473,  0.5725490196078431 ,  0.77647058823529413),
    (0.12941176470588237,  0.44313725490196076,  0.70980392156862748),
    (0.03137254901960784,  0.31764705882352939,  0.61176470588235299),
    (0.03137254901960784,  0.18823529411764706,  0.41960784313725491)
    )
望采纳,谢谢。
不知道你这个问题是否已经解决, 如果还没有解决的话:- 你看下这篇博客吧, 应该有用👉 :机器学习基础:matplotlib的使用
如果你已经解决了该问题, 非常希望你能够分享一下解决方案, 写成博客, 将相关链接放在评论区, 以帮助更多的人 ^-^