MATLAB傅里叶反变换画时域图
clc,close,close all
syms t w
f1 = cos(t);
F1=fourier(f1)
f2=dirac(t);
F2=fourier(f2)
f3=heaviside(t);
F3=fourier(f3)
f4=exp(-2*abs(t));
F4=fourier(f4)
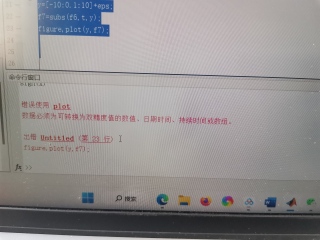
x=[-10:0.1:10]+eps;
F5=subs(F4,w,x);
figure,plot(x,F5);hold on;
F6=2/(i*w);
f6=ifourier(F6)
y=[-10:0.1:10]+eps;
f7=subs(f6,t,y);
figure,plot(y,f7);
报错
怎么能让第二个时域图输出来呢
查看f6内容可知,输出函数中有变量x,因此需要设置变量x,并将原来的x修改为x1,代码如下:
clear all,clc
syms t w x
f1 = cos(t);
F1=fourier(f1);

f2=dirac(t);
F2=fourier(f2);

f3=heaviside(t);
F3=fourier(f3);

f4=exp(-2*abs(t));
F4=fourier(f4);
x1=[-10:0.1:10]+eps;
F5=subs(F4,w,x1);
figure,plot(x1,F5);hold on;

F6=2/(i*w);
f6=ifourier(F6);
y1=[-10:0.1:10]+eps;
f7=subs(f6,x,y1);
figure,plot(y1,f7);
- 你可以看下这个问题的回答https://ask.csdn.net/questions/7774738
- 这篇博客你也可以参考下:MATLAB实现短时傅里叶变换
- 这篇博客也不错, 你可以看下MATLAB实现短时傅里叶变换
- 同时,你还可以查看手册:matlab 快速傅里叶变换 fft 中的内容