关于mplfinance画图的几个小问题
问题遇到的现象和发生背景
我已读入一个DataFrame并命名为df,然后用mplfinance画出K线图
用代码块功能插入代码,请勿粘贴截图
ma_list = [5,20,30,60]
save_path = r'C:\Users\Administrator\Desktop\aaa.png'
mpf.plot(df,type='candle',volume=True,style='yahoo',mav=ma_list,datetime_format='%y%m',xrotation=20,tight_layout=True,savefig=save_path)
我想要达到的结果
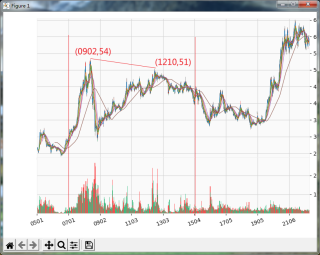
我希望图片是这样的:
1、能像matplotlib那样设置图片的大小(因为图片太小的话放大后就不够清晰),并能够按照设置的大小来保存。
2、希望可以设置要显示的纵坐标,其他坐标不显示(如图上两根垂直的红线)
3、我有2个点的坐标,希望可以在K线图上画出线段来(如图)
mpf.plot(df,type='candle',volume=True,style='yahoo',mav=ma_list,datetime_format='%y%m',
    xrotation=20,tight_layout=True,savefig=save_path,
    figsize=(10,6), # 控制图片大小
    vlines=dict( # 画两根竖线
        vlines=['11/4/2019', '11/26/2019'],
        colors='r',
        linestyle='-',
        linewidths=2,
    ),
    alines=dict( # 两个点画线段
        alines=[('11/1/2019',3000),('11/26/2019',3100)],
        colors=['r'],
        linestyle=['-'],
        linewidths=[1],
    ))