python数据处理
python 数据绘图处理
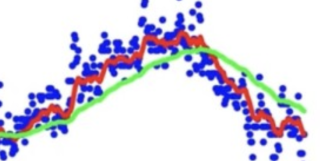
这个是数据的截图
https://img-mid.csdnimg.cn/release/static/image/mid/ask/421186182466143.png
根据下面公式获取数据的y 值,x=i++
把(x,y)坐标的散点图绘制在坐标系中,对点集合平滑处理为曲线
if filetype = ='2'
bandwidth = 1000 * 8 *fileByte/(totalTime-Rttime)
import csv
from matplotlib import pyplot as plt
from datetime import datetime
import numpy as np
from matplotlib import rc

filename = './input/1234562.csv'
with open(filename) as f:
    reader = csv.reader(f)
    header_row = next(reader) #调用next()方法,将阅读器对象的行传递给文件的第一行,并返回文件对象的下一行数据
    heads = []
    lows = []
    datas = []
    cows = []
    i = 0
    j=0
    nums = 0
    for rows in reader:
        RTT = rows[1]
        Totaltime = rows[2]
        downbyte = rows[3]
        filetype = rows[4]

        RTTs = RTT.split(',')
        Totaltimes = Totaltime.split(',')
        downbytes = downbyte.split(',')
        keys = filetype.split(',')
        #print(keys)
        #print(keys[0])
        for key in keys:
            j=j+1
            if key == '2':
                Downs =downbytes[j-1]
                rtts = RTTs[j-1]
                totaltime = Totaltimes[j-1]
                print(Downs,rtts,totaltime)
                if totaltime != rtts:
                    asim =int(Downs) * 1000 * 8 /(int(totaltime) - int(rtts ))
                    print(int(Downs) ,int(totaltime) - int(rtts ))
                    lows.append(asim)
                    cows.append(i)
                    i=i+1
        j=0

    print(lows)

    fig = plt.figure(dpi=128, figsize=(15,9))
    #Splt = fig.add_subplot(111)
    plt.plot(cows,lows, '-', label = 'Quantity 1', c='red')
    #plt2 = plt.twinx()
    #plt2.plot(datas, lows, '-', label = 'Quantity 2', c='blue')
    plt.legend(loc=0)
    plt.grid()
    plt.title("Levels",fontsize = 24)
    plt.xlabel('nums',fontsize = 16)
    plt.ylabel('level',fontsize= 16)
    #plt2.ylabel('bwe',fontsize= 16)
    plt.show()
运行结果及报错内容
Input In [9]
lows.append(asim)
^
SyntaxError: invalid syntax
我的解答思路和尝试过的方法
if filetype = ='2'
bandwidth = 1000 * 8 *fileByte/(totalTime-Rttime)
我想要达到的结果
第35行括号没匹配,改为
asim =int(Downs * 1000 * 8 /(int(totaltime - int(rtts ))))
- 可以查看手册:python-互联网数据处理 中的内容