Echart滚动条的滑块怎么设置到最上面
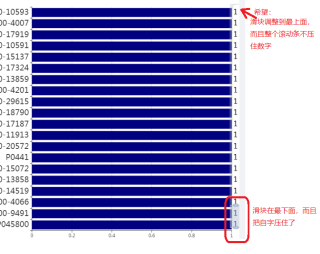
在Vue中使用Echarts制作了一个条形图,y轴带滚动条,但滚动条的滑块默认情况下总是在最下面,而且把数据标签也给压住了。
我想调整如下:
1- 默认情况下,滚动条的滑块在最上面。
2- 滚动条在整个数据区的右侧,不压住数据标签。
怎么改代码呢?请指教。
代码如下:
 let option = {
        backgroundColor: '#fff',
        title: {
          text: '数据分布',
          padding:[10,800,0,40],     // 四个数字分别为上右下左与原位置距离
        },
        grid: {
          top: 40,
          bottom: 10,
          left: 45,
          right: 20,
          containLabel: true
        },
        xAxis: {
          type: 'value',
        },
        yAxis: {
          type: 'category',
          data: this.x_date,
          axisLabel: {
            fontSize: 20
          },
        },
        series: [
        {
            data: this.s_data,
            type: "bar",
            barGap: 100,
            itemStyle: {
                normal: {
                    color: 'rgba(0, 0, 128, 1)',
                    label: {
                        show: true, //开启显示
                        position: 'right', //在右侧显示
                        textStyle: { //数值样式
                            color: 'black',
                            fontSize: 18
                        },
                    },
                },
             },
          },
        ],
        dataZoom: [
          {
            type: "slider",
            show: true,
            yAxisIndex: [0],
            startValue: 0,  // 从头开始
            endValue: 19,   // 一屏展示20条
            left: '97%',
            top: 30,    //上边的距离
            // height: '80%',//组件高度
            // left: 600, //左边的距离
            // right: 8,//右边的距离
            // barWidth: 10000,
            zoomLock: true,
            maxValueSpan: 20,   // 显示数据的最大条数
            start: 0,
            end: 10
          },
          // 滑块的属性
          // {
          //   type: "inside",
          //   show: true,
          //   yAxisIndex: [0,1],
          //   start: 1,
          //   end: 9
          // }
        ],
        tooltip:{
          trigger: "axis",  //触发类型--坐标轴
        }
      };
请帮助回答一下吧