Python提问,求程序并有注释,
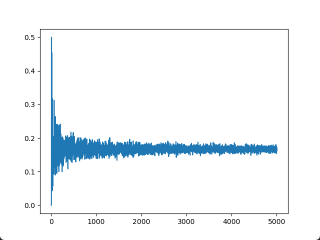
.模拟抛掷一枚均匀骰子的随机试验,利用Python编程计算点数5向.上的次数与抛掷骰子总次数的比值,假设取抛掷硬币总次数为n=5000, 可以使用np.random.randint( )获得相应点数5朝上的随机数,画出n从1-5000取值时比值的图形。(观察比值是不是趋近于1/6)
这么简单要什么注释
import numpy as np
from matplotlib import pyplot as plt

x = list(range(1,5001)) # 取 n 从 1 到 5000
y = [np.sum(np.random.randint(1, 7, i) == 5)/i for i in range(1,5001)] # 每次取 i 个骰子,计算 5 出现的概率

plt.plot(x, y) # 画图
plt.show() # 显示图像
import numpy as np  # 导入numpy
from matplotlib import pyplot as plt  # 导入matplotlib的pyplot

x = list(range(1,5001))   # 区间[1, 5001)组成的列表
y = [np.sum(np.random.randint(1, 7, i) == 5) / i for i in x]  # for循环取骰子,每次取i个,也就是np.random.randint(1, 7, i),np.sum()是相加,最后除以i就是概率

plt.plot(x, y)  # 画图
plt.show() # 显示画完的图像