R语言绘制河流图报错处理
我想用R语言绘制河流图
element_text设置字体 scale_x_continuous更换横轴标签 labs(fill="") 无标签图例
p<-ggplot(dataframe,aes(x = CPP_phase,y = genus,fill=Name)) + theme_bw() +
theme(panel.grid.major=element_line(colour=NA),
panel.background = element_rect(fill = "transparent",colour = NA),
plot.background = element_rect(fill = "transparent",colour = NA),
panel.grid.minor = element_blank(),
text=element_text(family="A",size = 9))+
scale_x_continuous(breaks =dataframe$CPP_phase,labels=rep(c('pre','acq','ext','rein'),times=10))+labs(fill="")
p
这是我的代码
以下是报错内容
scale_x_continuous(breaks =dataframe$CPP_phase,labels=rep(c('pre','acq','ext','rein'),times=10))+labs(fill="")
Error in+.gg:
! Cannot add ggproto objects together. Did you forget to add this object to a ggplot object?
Runrlang::last_error()to see where the error occurred.
rlang::last_error()
Error in$<-.data.frame(*tmp*, "call_text", value = c("\033[38;5;232m\033[1\m033[94mggplot2:::+.gg(\033[38;5;232\033[22\033[39mscale_x_continuous(breaks = dataframe$CPP_phase, labels = rep(c("pre", "acq", "ext"\033[38;5;232033[1033[94)033[38;5;232033[22\033[39", :
替换数据里有2行,但数据有1
我试了很多次,不知道问题出在了哪里。
我了解了下你的这个代码,看需求应该是替换掉原本的x轴标签,你用的这个“scale_x_continuous”方法报错提示应替换标签数目与绘制的x轴标签刻度数不匹配的。
对于标签替换,我提供下我的处理思路:
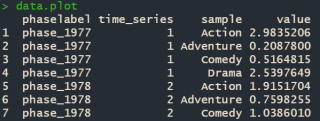
这是我用于绘图的数据data.plot,数据表有4列,以下是这四列的属性:
> str(data.plot)
'data.frame':    38 obs. of  4 variables:
 $ phaselabel : Factor w/ 43 levels "phase_1977","phase_1978",..: 1 1 1 1 2 2 2 2 3 3 ...
 $ time_series: int  1 1 1 1 2 2 2 2 3 3 ...
 $ sample     : chr  "Action" "Adventure" "Comedy" "Drama" ...
 $ value      : num  2.984 0.209 0.516 2.54 1.915 ...
其中,第一列phaselabel 是用于更改的x轴标签,属性为字符串;第二列time_series是用于绘制geom_stream()x轴提供的时间序列,是一个数值型序列;第三列sample 是样本;第四列是每个时间点上每个样本的值,属性为数值型序列。
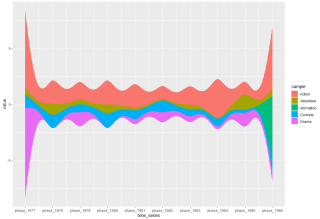
这是绘图函数:
ggplot(data.plot,aes(x = time_series,y = value,fill=sample)) + geom_stream() +
    scale_x_continuous(breaks = seq(1,max(data.plot$time_series)),labels = unique(data.plot$phaselabel))  #调整x轴的刻度标签,按一个单位分隔开来,每个单位的刻度替换为unique(data.plot$phaselabel)中的标签
出图结果
- 随机森林
我在⽤R语⾔做⽂本分析后的数据的预测的时候发现,在进⾏随机森林建模时报错:Error in eval(predvars, data, env) : 找不到对
象’000’。
经过分析,这是因为使⽤了不合法的变量名的原因。随机森林对这点⽐较敏感。像决策树和朴素贝叶斯可能不会报错。
解决⽅法
像我这个,就是⽤了000作为变量名,这是不合法的,⼀种解决思路是修改不合法的变量名,或者将其转为合法化。
names(data) <- make.names(names(data))
- 中⽂路径问题
搜索可以发现有很多种解决⽅法,但有时候⽤户名设置为中⽂,修改的话会⽐较⿇烦,更重要的是,在⽂本分析的时候,如果⽂本是英⽂,⽽路径是中⽂,那么在分析的时候就会报错。我发现了⼀个有趣的⽅法,可以试试。
Sys.setlocale("LC_ALL", "C")#将语⾔改为英⽂
Sys.setlocale("LC_ALL", "Chinese")#将语⾔改为中⽂
如果遇到报错,可以切换这两个语句,解决!
element_text设置字体 scale_x_continuous更换横轴标签 labs(fill="") 无标签图例
p<-ggplot(dataframe,aes(x = CPP_phase,y = genus,fill=Name)) + theme_bw() +
theme(panel.grid.major=element_line(colour=NA),
panel.background = element_rect(fill = "transparent",colour = NA),
plot.background = element_rect(fill = "transparent",colour = NA),
panel.grid.minor = element_blank(),
text=element_text(family="A",size = 9))+labs(fill="") +
scale_x_continuous(breaks =unique(dataframe$CPP_phase),labels = c('pre','acq','ext','rein'))+labs(fill="")
p
这是我的代码。同样的问题,它还会出现下面这样的报错。
Error: Discrete value supplied to continuous scale
不知道问题出现在了哪里