用matplotlib的monthlocator()绘制的月度时间横坐标如何修改?
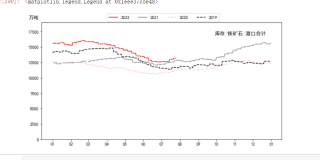
如图,横轴是一组时间序列的日期,用matplotlib.dates的monthlocator('%m')表示为月,纵轴是时间序列的值。结果在12月后面多了一个1月,而且怎么删也删不掉,包括设置monthlocator的内部参数bymonthday也没用。于是我怀疑是数据的问题,但是数据看上去也很正常。求问如何把最后一个01删掉?
代码:
fig = plt.figure(figsize = [10, 5])
ax = fig.add_subplot(1, 1, 1)
ax.plot(df_2.loc[:, '2022'], color = 'red', linestyle = 'solid', label = '2022')
ax.plot(df_2.loc[:, '2021'], color = 'grey', linestyle = 'solid', label = '2021')
ax.plot(df_2.loc[:, '2020'], color = 'pink', linestyle = 'dashed', label = '2020')
ax.plot(df_2.loc[:, '2019'], color = 'black', linestyle = 'dashed', label = '2019')
plt.xticks(rotation='horizontal')
ax.xaxis.set_major_locator(MonthLocator())
ax.xaxis.set_major_formatter(DateFormatter('%m'))
ax.set_ylim([0, 19000])
plt.figtext(0.85, 0.825, df_type, fontsize = 'large',
horizontalalignment = 'right',
verticalalignment = 'top')
plt.figtext(0.115, 0.925, '万吨', fontsize = 'large',
horizontalalignment = 'right',
verticalalignment = 'top')
ax.legend(loc = 'best', bbox_to_anchor = (0.75, 1.095), borderpad=0.5, labelspacing=0.5, ncol = 4)
成图:
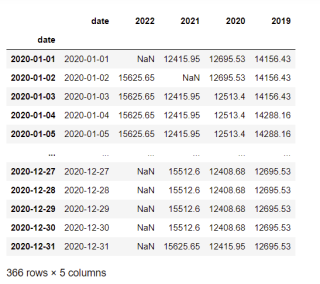
下面是数据:
把下列代码换成里面的代码试试:
ax.xaxis.set_major_locator(MonthLocator())
ax.xaxis.set_major_formatter(DateFormatter('%m'))
#Add to plot settings:
ax.set_xlim(np.datetime64('1970-01-01'), np.datetime64('1970-12-31'))
ax.xaxis.set_major_locator(MonthLocator(bymonthday=1))
ax.xaxis.set_major_formatter(md.DateFormatter('%b'))
- 代码应该没问题,12月31号之后本来就是1月
- 如果需要那个坐标刻度下不显示文字
01可以重设xtick,把最后一个文字置为空locs = ax.get_xticks() labels = ax.get_xticklabels() labels[-2] = '' ax.set_xticks(locs[1:-1]) ax.set_xticklabels(labels[1:-1])
先看看横坐标的年份是哪年的限制一下横坐标的最大值,只能去那个年份的1月到十二月

Matplotlib 中的 ticker 模块用于支持坐标轴刻度的修改,调用下列命令可以初步查看主副坐标轴刻度的数值定位方式(locator)与具体格式(formatter):

print(ax.xaxis.get_major_locator())
print(ax.xaxis.get_minor_locator())

<matplotlib.ticker.LogLocator object at 0x107530cc0>
<matplotlib.ticker.LogLocator object at 0x107530198>

print(ax.xaxis.get_major_formatter())
print(ax.xaxis.get_minor_formatter())

<matplotlib.ticker.LogFormatterMathtext object at 0x107512780><matplotlib.ticker.NullFormatter object at 0x10752dc18>

我们可以使用 set_major_locator 和 set_major_formatter 命令来调整坐标轴的刻度,如去除坐标轴的刻度显示:

ax = plt.axes()
ax.plot(np.random.rand(50))

ax.yaxis.set_major_locator(plt.NullLocator())
ax.xaxis.set_major_formatter(plt.NullFormatter())
我一般是用这俩句来修改比较多
ax.yaxis.set_major_locator(plt.NullLocator())
ax.xaxis.set_major_formatter(plt.NullFormatter())