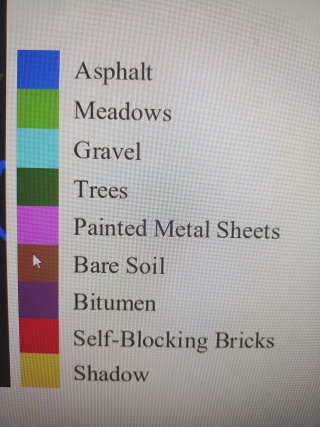
如何用python画出这样的图
如何用python画出这样的图片,左边是颜色块,右边是名称。
turtle库,可以参见下文中的例二:
https://blog.csdn.net/boysoft2002/article/details/115016170
柱状堆叠
matplotlib的柱状图应该可以
import matplotlib.pyplot as plt
import matplotlib.colors as mcolors


def plot_colortable(colors, title, sort_colors=True, emptycols=0):

    cell_width = 212
    cell_height = 22
    swatch_width = 48
    margin = 12
    topmargin = 40

    # Sort colors by hue, saturation, value and name.
    if sort_colors is True:
        by_hsv = sorted((tuple(mcolors.rgb_to_hsv(mcolors.to_rgb(color))),
                         name)
                        for name, color in colors.items())
        names = [name for hsv, name in by_hsv]
    else:
        names = list(colors)

    n = len(names)
    ncols = 4 - emptycols
    nrows = n // ncols + int(n % ncols > 0)

    width = cell_width * 4 + 2 * margin
    height = cell_height * nrows + margin + topmargin
    dpi = 72

    fig, ax = plt.subplots(figsize=(width / dpi, height / dpi), dpi=dpi)
    fig.subplots_adjust(margin/width, margin/height,
                        (width-margin)/width, (height-topmargin)/height)
    ax.set_xlim(0, cell_width * 4)
    ax.set_ylim(cell_height * (nrows-0.5), -cell_height/2.)
    ax.yaxis.set_visible(False)
    ax.xaxis.set_visible(False)
    ax.set_axis_off()
    ax.set_title(title, fontsize=24, loc="left", pad=10)

    for i, name in enumerate(names):
        row = i % nrows
        col = i // nrows
        y = row * cell_height

        swatch_start_x = cell_width * col
        swatch_end_x = cell_width * col + swatch_width
        text_pos_x = cell_width * col + swatch_width + 7

        ax.text(text_pos_x, y, name, fontsize=14,
                horizontalalignment='left',
                verticalalignment='center')

        ax.hlines(y, swatch_start_x, swatch_end_x,
                  color=colors[name], linewidth=18)

    return fig

# 这里的颜色值自行修改成想要的颜色
mc = {'Asphalt': (0, 0, 1),
 'Meadows': (0, 0.5, 0),
 'Gravel': (1, 0, 0),
 'Trees': (0, 0.75, 0.75),
 'Painted Metal Sheets': (0.75, 0, 0.75),
 'Bare Soil': (0.75, 0.75, 0),
 'Bitumen': (0, 0, 0),
 'Self-Blocking Bricks': (1, 1, 1),
'Shadow': (1, 1, 1),
}
plot_colortable(mc, "Base Colors",
                sort_colors=False, emptycols=3)
plt.show()