prometheus自定义监控数据如何画图?
问题遇到的现象和发生背景
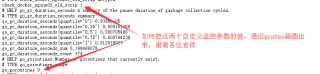
prometheus 自定义参数获取数值后怎么画图(通过grafana),自定义获取的数值如下:
check_docker_nginx02_old_scrip 1
go_goroutines 9
操作环境、软件版本等信息
prometheus-2.36.0.linux-amd64
alertmanager-0.24.0.linux-amd64
blackbox_exporter-0.21.0.linux-amd64
grafana-8.5.4
centos 7.9
尝试过的解决方法
没头绪,也没思路
我想要达到的结果
http://192.168.7.63:9100/metrics
弄一个类似下面的图出来即可,谢谢
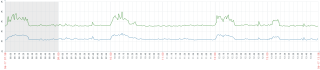
先把该prometheus数据源添加到grafana,然后添加图像,设置参数和条件
