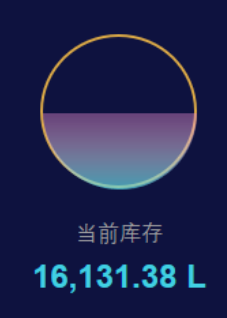
echarts水球图

echarts水球图,怎么样做成这种效果


let data = [16131];
 option = {
   title: [
        {
            text: '当前库存',
            x: '47%',
            y: '70%',
            textStyle: {
                fontSize: 14,
                fontWeight: '100',
                color: '#5dc3ea',
                lineHeight: 16,
                textAlign: 'center',
            },
        }
    ],
        series: [
          {
            type: "liquidFill",
            data: data,
            direction: "false", //波浪方向或者静止
            radius: "30%",
            // 水球颜色
            color: [
                {
                    type: 'linear',
                    x: 0,
                    y: 0,
                    x2: 0,
                    y2: 1,
                    colorStops: [
                        {
                            offset: 1,
                            color: '#5293ab', //下
                        },
                        {
                            offset: 0,
                            color: '#69457b',
                        },
                    ],
                    globalCoord: false,
                },
            ],
            center: ["50%", "50%"], //水球位置
            // outline  外边
            outline: {
              // show: false
              borderDistance: 0, //内环padding值
              itemStyle: {
                borderWidth: 8, //圆边线宽度
                borderColor: "#d3a345",
              }
            },
            backgroundStyle: {
                // borderWidth: 5,
                // borderColor: 'rgb(255,0,255,0.9)',
                color: 'rgb(255,0,255,0.01)'
            },
            label: {
              show: false
            }
          }
        ]
      };

img

直接用canvas画还快一些

这个专门画水球的,参考一下

参考这个里的 水球图 ,有代码 还可以在线看效果