matlab如何实现二维分布抽样
假设二维分布是类似图1这种二元指数多项式,参数我是随意给的,啥都行,其图形大致为图二。x范围是0-20,y范围是0-2π
式子满足概率密度函数的特性,其x从0-20,y从0-2π的积分为1,因为函数比较复杂,累积分布无法直接积分得出式子,要如何对这种简单的二维分布进行抽样

- 最简单的方法是直接接受拒绝抽样,x,y在0-20,0-2pi均匀抽,同时抽样z 在0-1之间,每次算f(x,y),f(x,y)>=z就接收,否则就拒绝。但是这个方法效率比较低,尤其是边缘处大部分样本会被拒绝掉
- 稍微复杂并且高效的方式是Markov Chain Monte Carlo(MCMC)方法,对于两变量的采样,有一类属于MCMC的方法叫做Gibbs MCMC,可以同时采样多个变量。具体做法是先初始化(x_0,y_0),然后按照某种方式构造Markov链,之后判定是否采用下一个采样。这种方法可以利用所有的抽样(除了最前面的部分点,这些点我们一般会把它扔掉)。算法不是特别复杂,但是理解比较费劲。
这是二维低通滤波器,或者说二维卷积。
这个形式的指数多项式写成矩阵形式,进行矩阵分解,分解为行向量与列向量的乘积。
W(x,y) = W1 * W2' = (1+a1x+a2x^2)* (1+b1y+b2y^2)'
也就是说,是一维垂直向量与一维水平向量的乘积。
F(x,y) = exp(W(x,y)) = exp(W1*W2')
利用卷积公式,就可以直接求解。
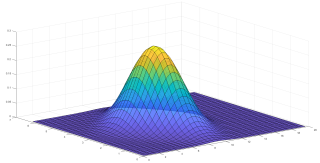
二维分布的实现方法如下:
x=-20:0.5:20;
y=-20:0.5:20;
mu=[-1,2];
sigma=[1 1; 1 3]; % 输入均值向量和协方差矩阵,可以根据需要修改
[X,Y]=meshgrid(x,y); % 产生网格数据并处理
p=mvnpdf([X(:),Y(:)],mu,sigma);
P=reshape(p,size(X)); % 求取联合概率密度
figure(2)
surf(X,Y,P)
shading interp
colorbar
title('表头');
Tristan Ursell
2D Random Number Generator for a Given Discrete Distribution
March 2012
[x0,y0]=pinky(Xin,Yin,dist_in,varargin);
'Xin' is a vector specifying the equally spaced values along the x-axis.
'Yin' is a vector specifying the equally spaced values along the y-axis.
'dist_in' (dist_in > 0) is a matrix with dimensions length(Yin) x length(Xin), whose values specify a 2D discrete probability distribution. The distribution does not need to be normalized.

'res' (res > 1) is a multiplicative increase in the resolution of chosen random number, using cubic spline interpolation of the values in 'dist_in'. Using the 'res' option can significantly slow down the code, due to the computational costs of interpolation, but allows one to generate more continuous values from the distribution.

[x0,y0] is the output doublet of random numbers consistent with dist_in.

The 'gendist' function required by this script, is included in this m-file.

Example with an anisotropic Gaussian at native resolution:

Xin=-10:0.1:10;
Yin=-5:0.1:5;

Xmat = ones(length(Yin),1)*Xin;
Ymat = Yin'*ones(1,length(Xin));

D1=1;
D2=3;
Dist=exp(-Ymat.^2/(2*D1^2)-Xmat.^2/(2*D2^2));

N=10000;

vals=zeros(2,N);
for i=1:N
[vals(1,i),vals(2,i)]=pinky(Xin,Yin,Dist);
end

figure;
hold on
imagesc(Xin,Yin,Dist)
colormap(gray)
plot(vals(1,:),vals(2,:),'r.')
xlabel('Xin')
ylabel('Yin')
axis equal tight
box on

Example with multiple peaks at 10X resolution:

Xin=-10:0.1:10;
Yin=-5:0.1:5;

Xmat = ones(length(Yin),1)*Xin;
Ymat = Yin'*ones(1,length(Xin));

D1=0.5;
D2=1;
Dist=exp(-(Ymat-3).^2/(4*D2^2)-(Xmat+6).^2/(2*D1^2))+exp(-(Ymat+2).^2/(2*D1^2)-(Xmat+1).^2/(2*D2^2))+exp(-(Ymat-1).^2/(2*D1^2)-(Xmat-2).^2/(2*D2^2));

N=10000;
res=10;
vals=zeros(2,N);
for i=1:N
[vals(1,i),vals(2,i)]=pinky(Xin,Yin,Dist,res);
end

figure;
hold on
imagesc(Xin,Yin,Dist)
colormap(gray)
plot(vals(1,:),vals(2,:),'r.')
xlabel('Xin')
ylabel('Yin')
axis equal tight
box on
可以考虑分开抽样,分别进行计算。
拿参加数模的经验来说 实现二维分布需要以下几步
第一步,基于实验获得一条数据,要确定是否服从分布,将其转换为直方图,
第二步,从绘制的直方图中可以看出,该数据近似正态分布。从原始数据计算出的正态分布的关键值为:平均值,方差和标准差等等,
第三步,f =@(x)normpdf(x,均值,标准差),总概率密度f *等于拟合频数,然后拟合图。
第四步,如果要绘制频率概率图,则该方法与此类似,只需将频率除以总数即可得到频率,而正态分布f(x)为概率。
望采纳谢谢啦