vue中使用echarts双层仪表盘
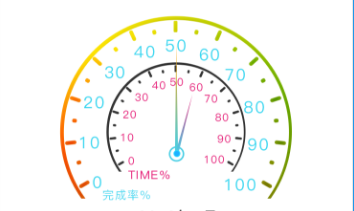
这个仪表盘有人知道要怎么写吗
哈哈,试了下,感觉除了指针尾部的点带个圆圈做不出来之外,其他的都可以的 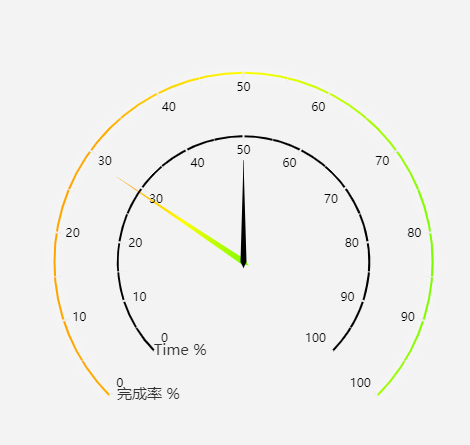
series: [
        {
            type: 'gauge',

            axisLine:{
                lineStyle:{
                    width:2,
                    color: [
                        [1, new echarts.graphic.LinearGradient(0, 0, 1, 0, [{
                                offset: 0.1,
                                color: "#FFA500"
                            },
                            {
                                offset: 0.5,
                                color: "#FFFF00"
                            },
                            {
                                offset: 1,
                                color: "#7CFC00"
                            }
                        ])]
                    ],
                    shadowColor : '#fff', //默认透明
                    shadowBlur: 10
                }
            },
            splitLine:{
                length:5
            },
            axisTick:{
                splitNumber:2
            },
            pointer:{
                width:3
            },
            title:{
                offsetCenter:['-50%','70%']
            },
            detail: {show:false},
            data: [{value: 50, name: '完成率 %'}]
        },
        {
            type: 'gauge',
            radius: '50%',
            axisLine:{
                lineStyle:{
                    width:2,
                    color:[[0.1, '#000000'],[1, '#000000']]
                }
            },
            splitLine:{
                length:5,
                color:'#000000'
            },
            axisTick:{
                splitNumber:2,
                color:'#000000'
            },
            pointer:{
                width:3
            },
            title:{
                offsetCenter:['-50%','70%']
            },
            detail: {show:false},
            data: [{value: 50, name: 'Time %'}]
        }
    ]