我把echarts里的漏斗图实例放到项目里发现少了些特性
官方实例里是这样的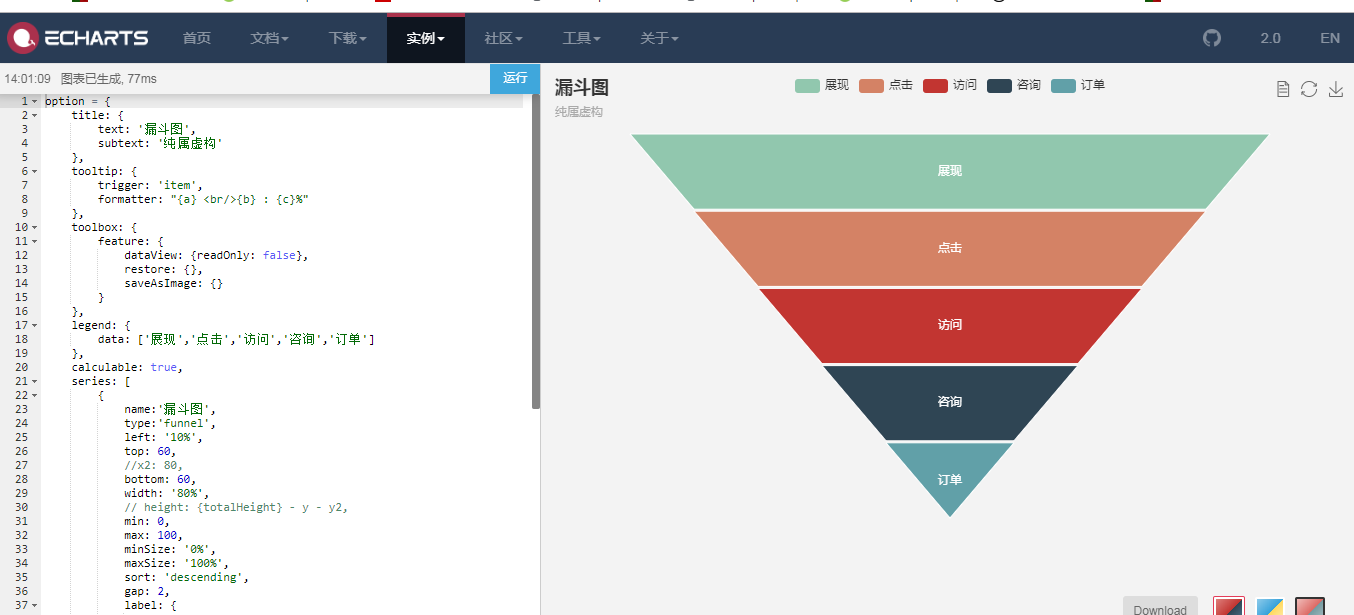 ,我放到项目里展示出来是这样的
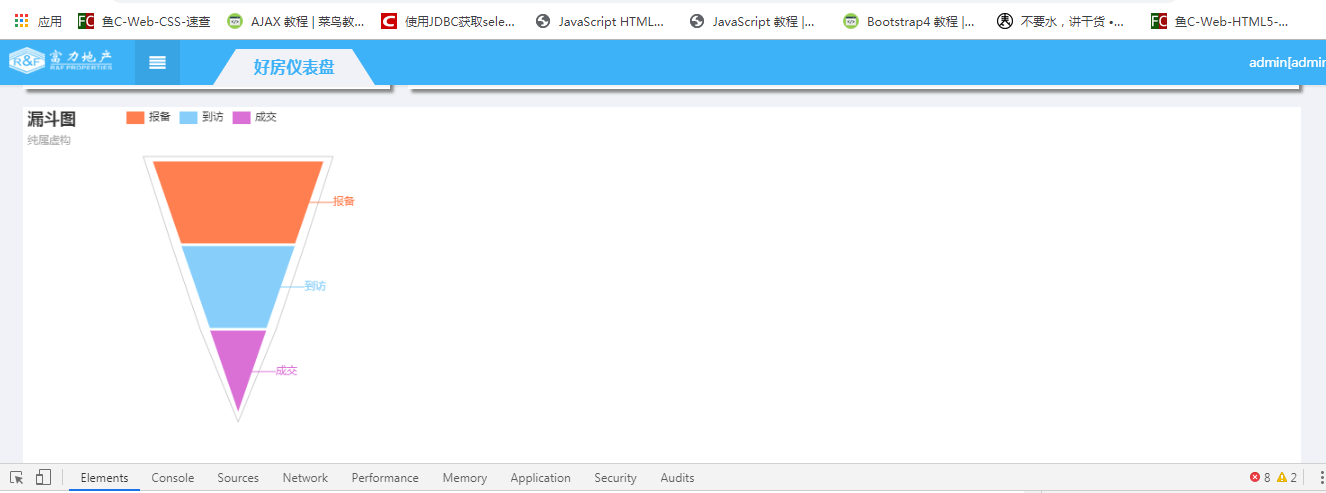 ,我数据可以和json中的格式对应上,我主要想问一下漏斗图中间的文字怎么没有了,然后该如何把图表的位置包括上面的label向左移一些,漏斗图标题可以不要,代码如下
json格式
图表代码
    echartfunnel: function(opts){
                var option = {
                     title: {
        text: '漏斗图',
        subtext: '纯属虚构'
    },
    tooltip: {
        trigger: 'item',
        formatter: "{a} <br/>{b} : {c}%"
    },
    toolbox: {
        feature: {
            dataView: {readOnly: false},
            restore: {},
            saveAsImage: {}
        }
    },
    legend: {
        data: ['报备','到访','成交']
    },
    calculable: true,
    series: [
        {
            name:'漏斗图',
            type:'funnel',
            left: '1%',
            top: 60,
            //x2: 80,
            bottom: 60,
            width: '80%',
            // height: {totalHeight} - y - y2,
            min: 0,
            max: 100,
            minSize: '0%',
            maxSize: '100%',
            sort: 'descending',
            gap: 2,
            label: {
                show: true,
                position: 'inside'
            },
            labelLine: {
                length: 10,
                lineStyle: {
                    width: 1,
                    type: 'solid'
                }
            },
            itemStyle: {
                borderColor: '#fff',
                borderWidth: 1
            },
            emphasis: {
                label: {
                    fontSize: 20
                }
            },
            data: opts.data
        }
    ]
    };
     return option;
}
html代码
<div is-echarts option="clientfunnel" style="height: 400px;width: 28%;display: inline-block;"></div>
angularjs控制器代码
    $scope.funnelClients = response.funnelClients;

                $scope.clientfunnel = charts.echartfunnel($scope.funnelClients);
https://blog.csdn.net/gray_key/article/details/80146445
我知道为什么,但问题是你还有没有 C 币?^_^
因为你这个图层样式的原因你可以看看这个地址有很详细的解释谢谢、
https://blog.csdn.net/gray_key/article/details/80146445
给不给无所谓。。。互相学习