echarts数据可视化

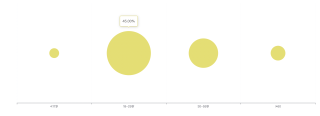
这个如何用echarts制作出来?散点图与折线图组合,想请教一下!
<!DOCTYPE html>
<html lang="zh-CN">
<head>
  <meta charset="utf-8">
  <title>Scatter on Single Axis - Apache ECharts Demo</title>
</head>
<body>
  <div id="chart-container"></div>
  <script src="https://cdn.jsdelivr.net/npm/echarts@5.3.2/dist/echarts.min.js"></script>
</body>
</html>
* {
  margin: 0;
  padding: 0;
}
#chart-container {
  position: relative;
  height: 100vh;
  overflow: hidden;
}
var dom = document.getElementById('chart-container');
var myChart = echarts.init(dom, null, {
  renderer: 'canvas',
  useDirtyRect: false
});
var app = {};

var option;

// prettier-ignore
const hours = [
    '≤17岁', '18-29岁', '30-59岁', '≥60'
];
// prettier-ignore
const days = [
    ''
];
// prettier-ignore
const data = [[0, 10], [1, 45], [2, 30], [3, 15]];
const title = [];
const singleAxis = [];
const series = [];
days.forEach(function (day, idx) {
  title.push({
    textBaseline: 'middle',
    top: ((idx + 0.5) * 100) / 2 + '%',
    text: day
  });
  singleAxis.push({
    left: 150,
    type: 'category',
    boundaryGap: true,
    data: hours,
    top: (idx * 100) + 5 + '%',
    height: 100  - 20 + '%',
    axisLabel: {
      interval: 0
    }
  });
  series.push({
    singleAxisIndex: idx,
    coordinateSystem: 'singleAxis',
    type: 'scatter',
    data: [],
    itemStyle:{
      normal:{
        color:'#e0d52d'
      }
    },
    label: {
      normal: {
        show: true,
        position: 'insideLeft',
      }
    },
    symbolSize: function (dataItem) {
      return dataItem[1]*4;
    }
  });
});
data.forEach(function (dataItem) {
  series[0].data.push([dataItem[0], dataItem[1]]);
});
option = {
  tooltip: {
    position: 'top',
    show: true,
    alwaysShowContent: true,
    formatter: function (params) {
        return params['data'][1] +   '.00%'
    }
  },
  title: title,
  singleAxis: singleAxis,
  series: series
};

if (option && typeof option === 'object') {
  myChart.setOption(option);
}

window.addEventListener('resize', myChart.resize);

//显示提示框
this.myChart.dispatchAction({
  type: 'showTip',
  seriesIndex:0,
  dataIndex:0
})
若有帮助,请及时采纳,谢谢~